Discussion Closed This discussion was created more than 6 months ago and has been closed. To start a new discussion with a link back to this one, click here.
Using a color scheme to indicate phase (direction) of surface displacement (revisited)
Posted Mar 3, 2023, 12:14 a.m. EST Acoustics & Vibrations, Results & Visualization, Structural Mechanics Version 6.1 4 Replies

Please login with a confirmed email address before reporting spam
The below post is related to an archived discussion
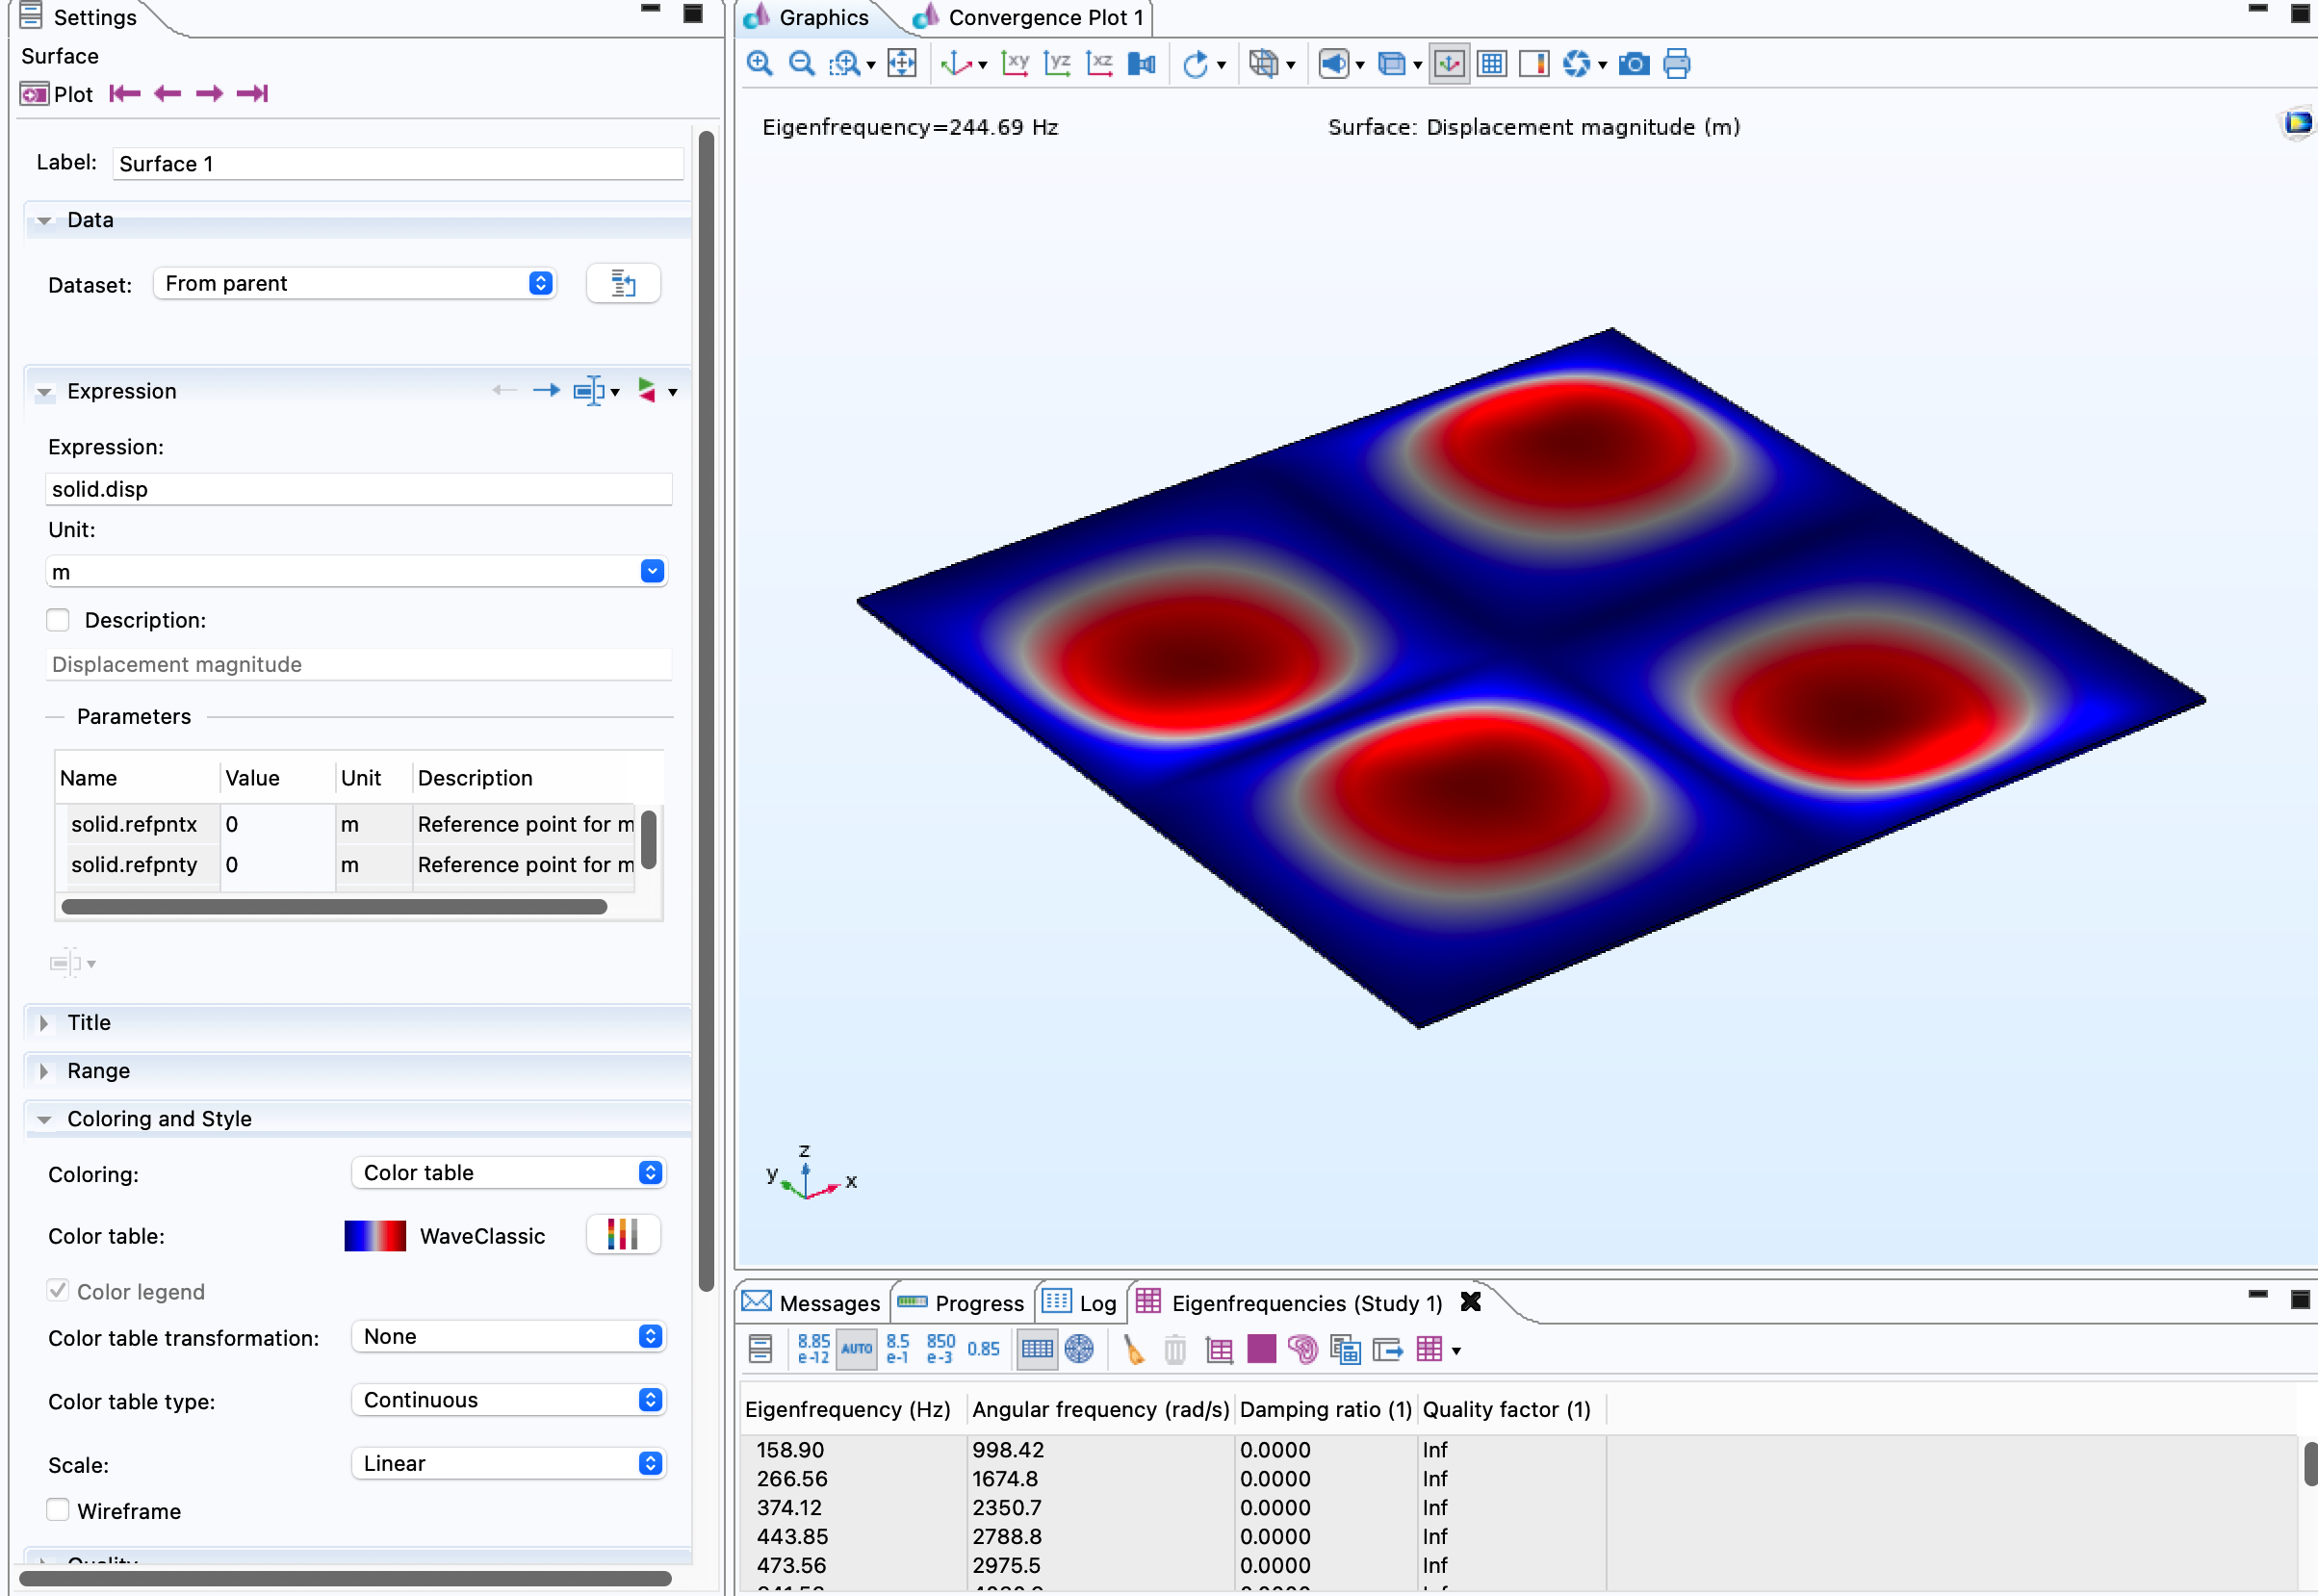
So, I'm still really frustrated that I cannot find a simple way to use a colormap that shows positive and negative displacements (or the phase) when visualizing structural mode shapes for an eigenfrequency. Here is the result I get for a COMSOL model of a simply supported thin plate. Notice that both the positive (+Z) and negative (-Z) displacements are red and the neutral plane (zero displacement) is blue.
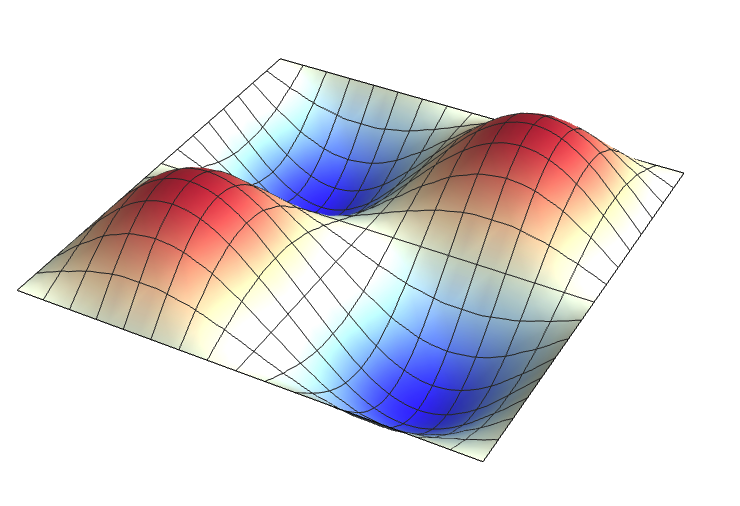
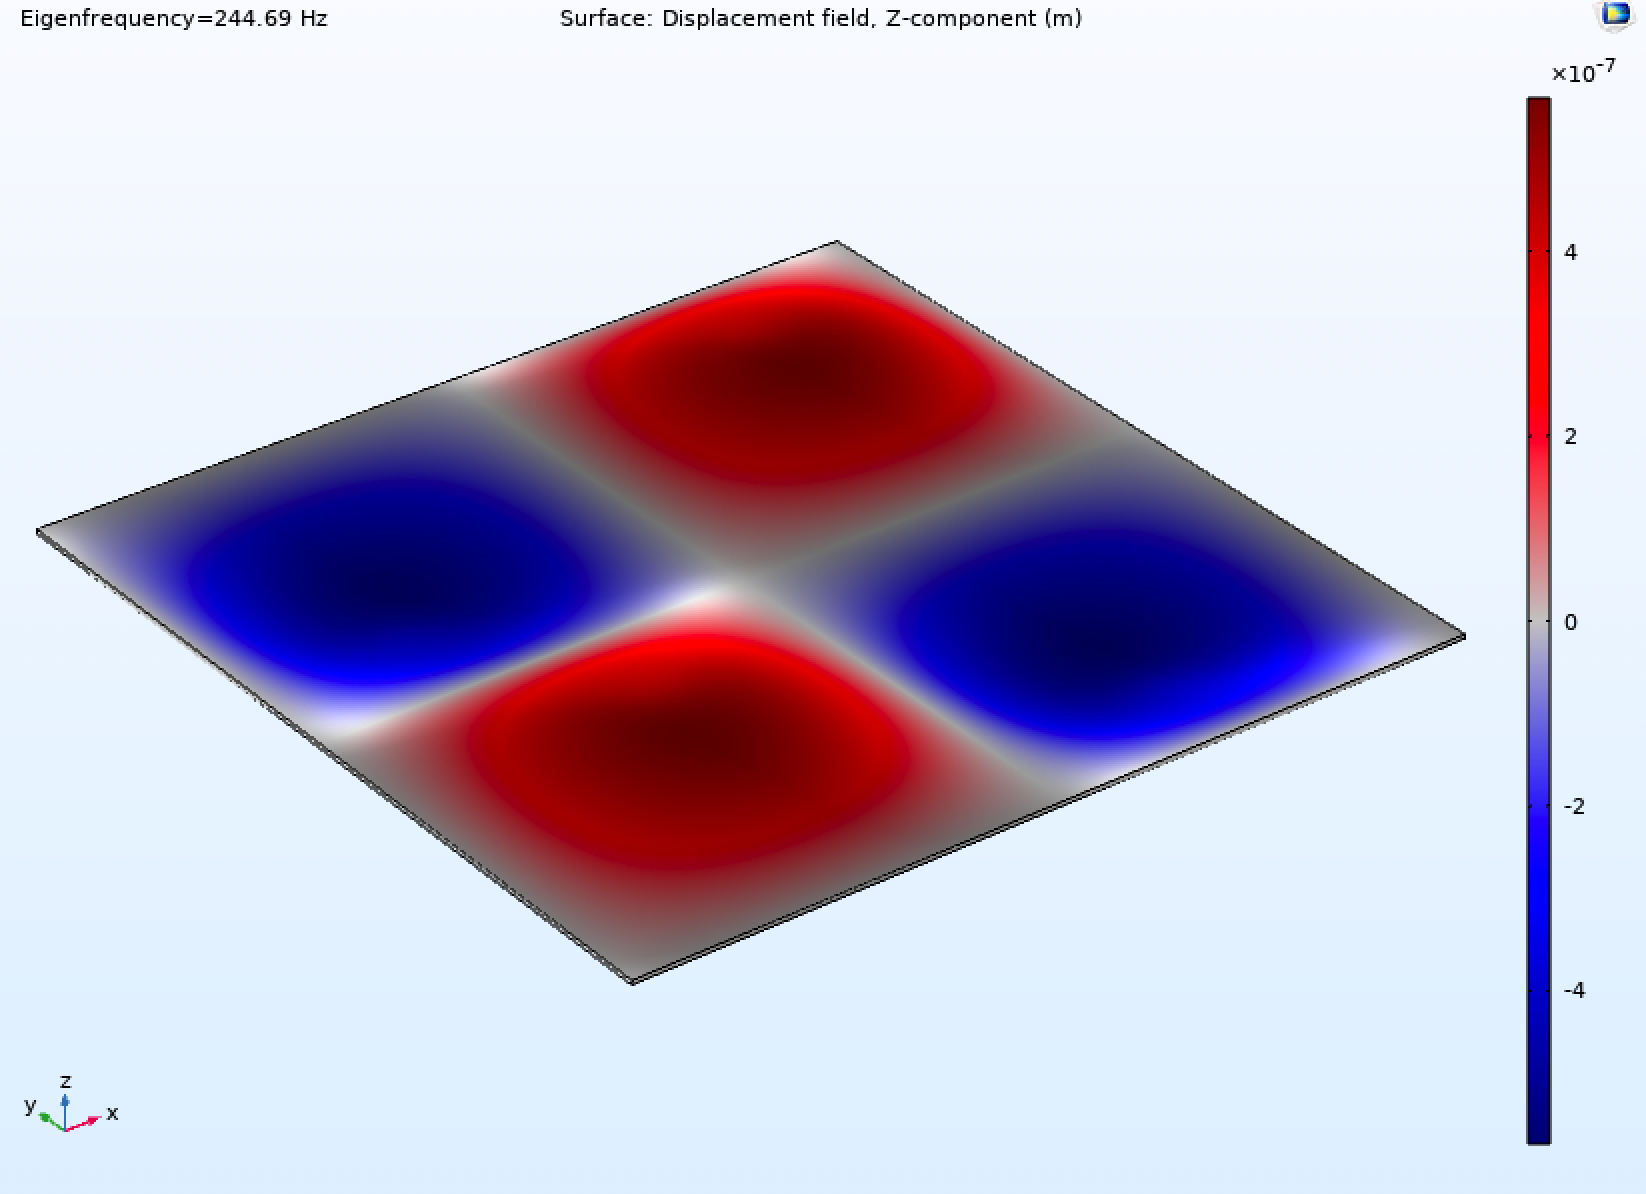
 What I really want is something like this (from Mathematica) where the zero displacement is white, positive displacment (up or +Z) is red, and negative displacement (down or -Z) is blue.
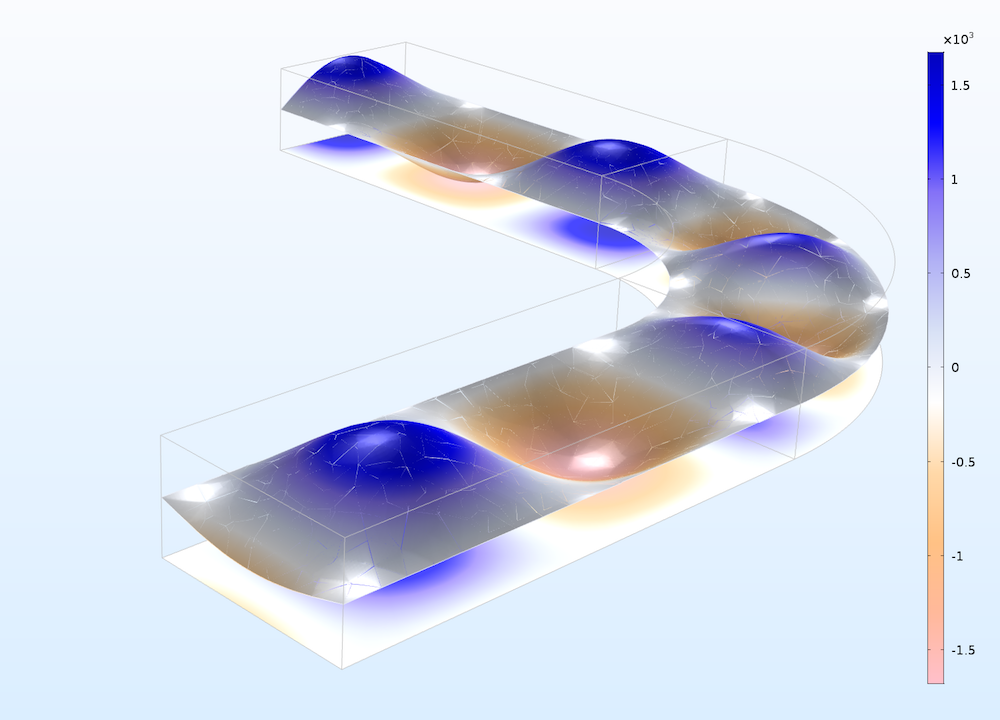
 Or something like this use of the Twilight color map to indicate positive and negative of the z-component of the electric field:
 (from:
https://www.comsol.com/blogs/enhance-your-visualization-plots-with-six-new-color-tables/)
How was that Twilight color map used to show positive and negative z-components of the electric field? That is what I want to do, but I can't figure out how to make it work in COMSOL.
(from:
https://www.comsol.com/blogs/enhance-your-visualization-plots-with-six-new-color-tables/)
How was that Twilight color map used to show positive and negative z-components of the electric field? That is what I want to do, but I can't figure out how to make it work in COMSOL.
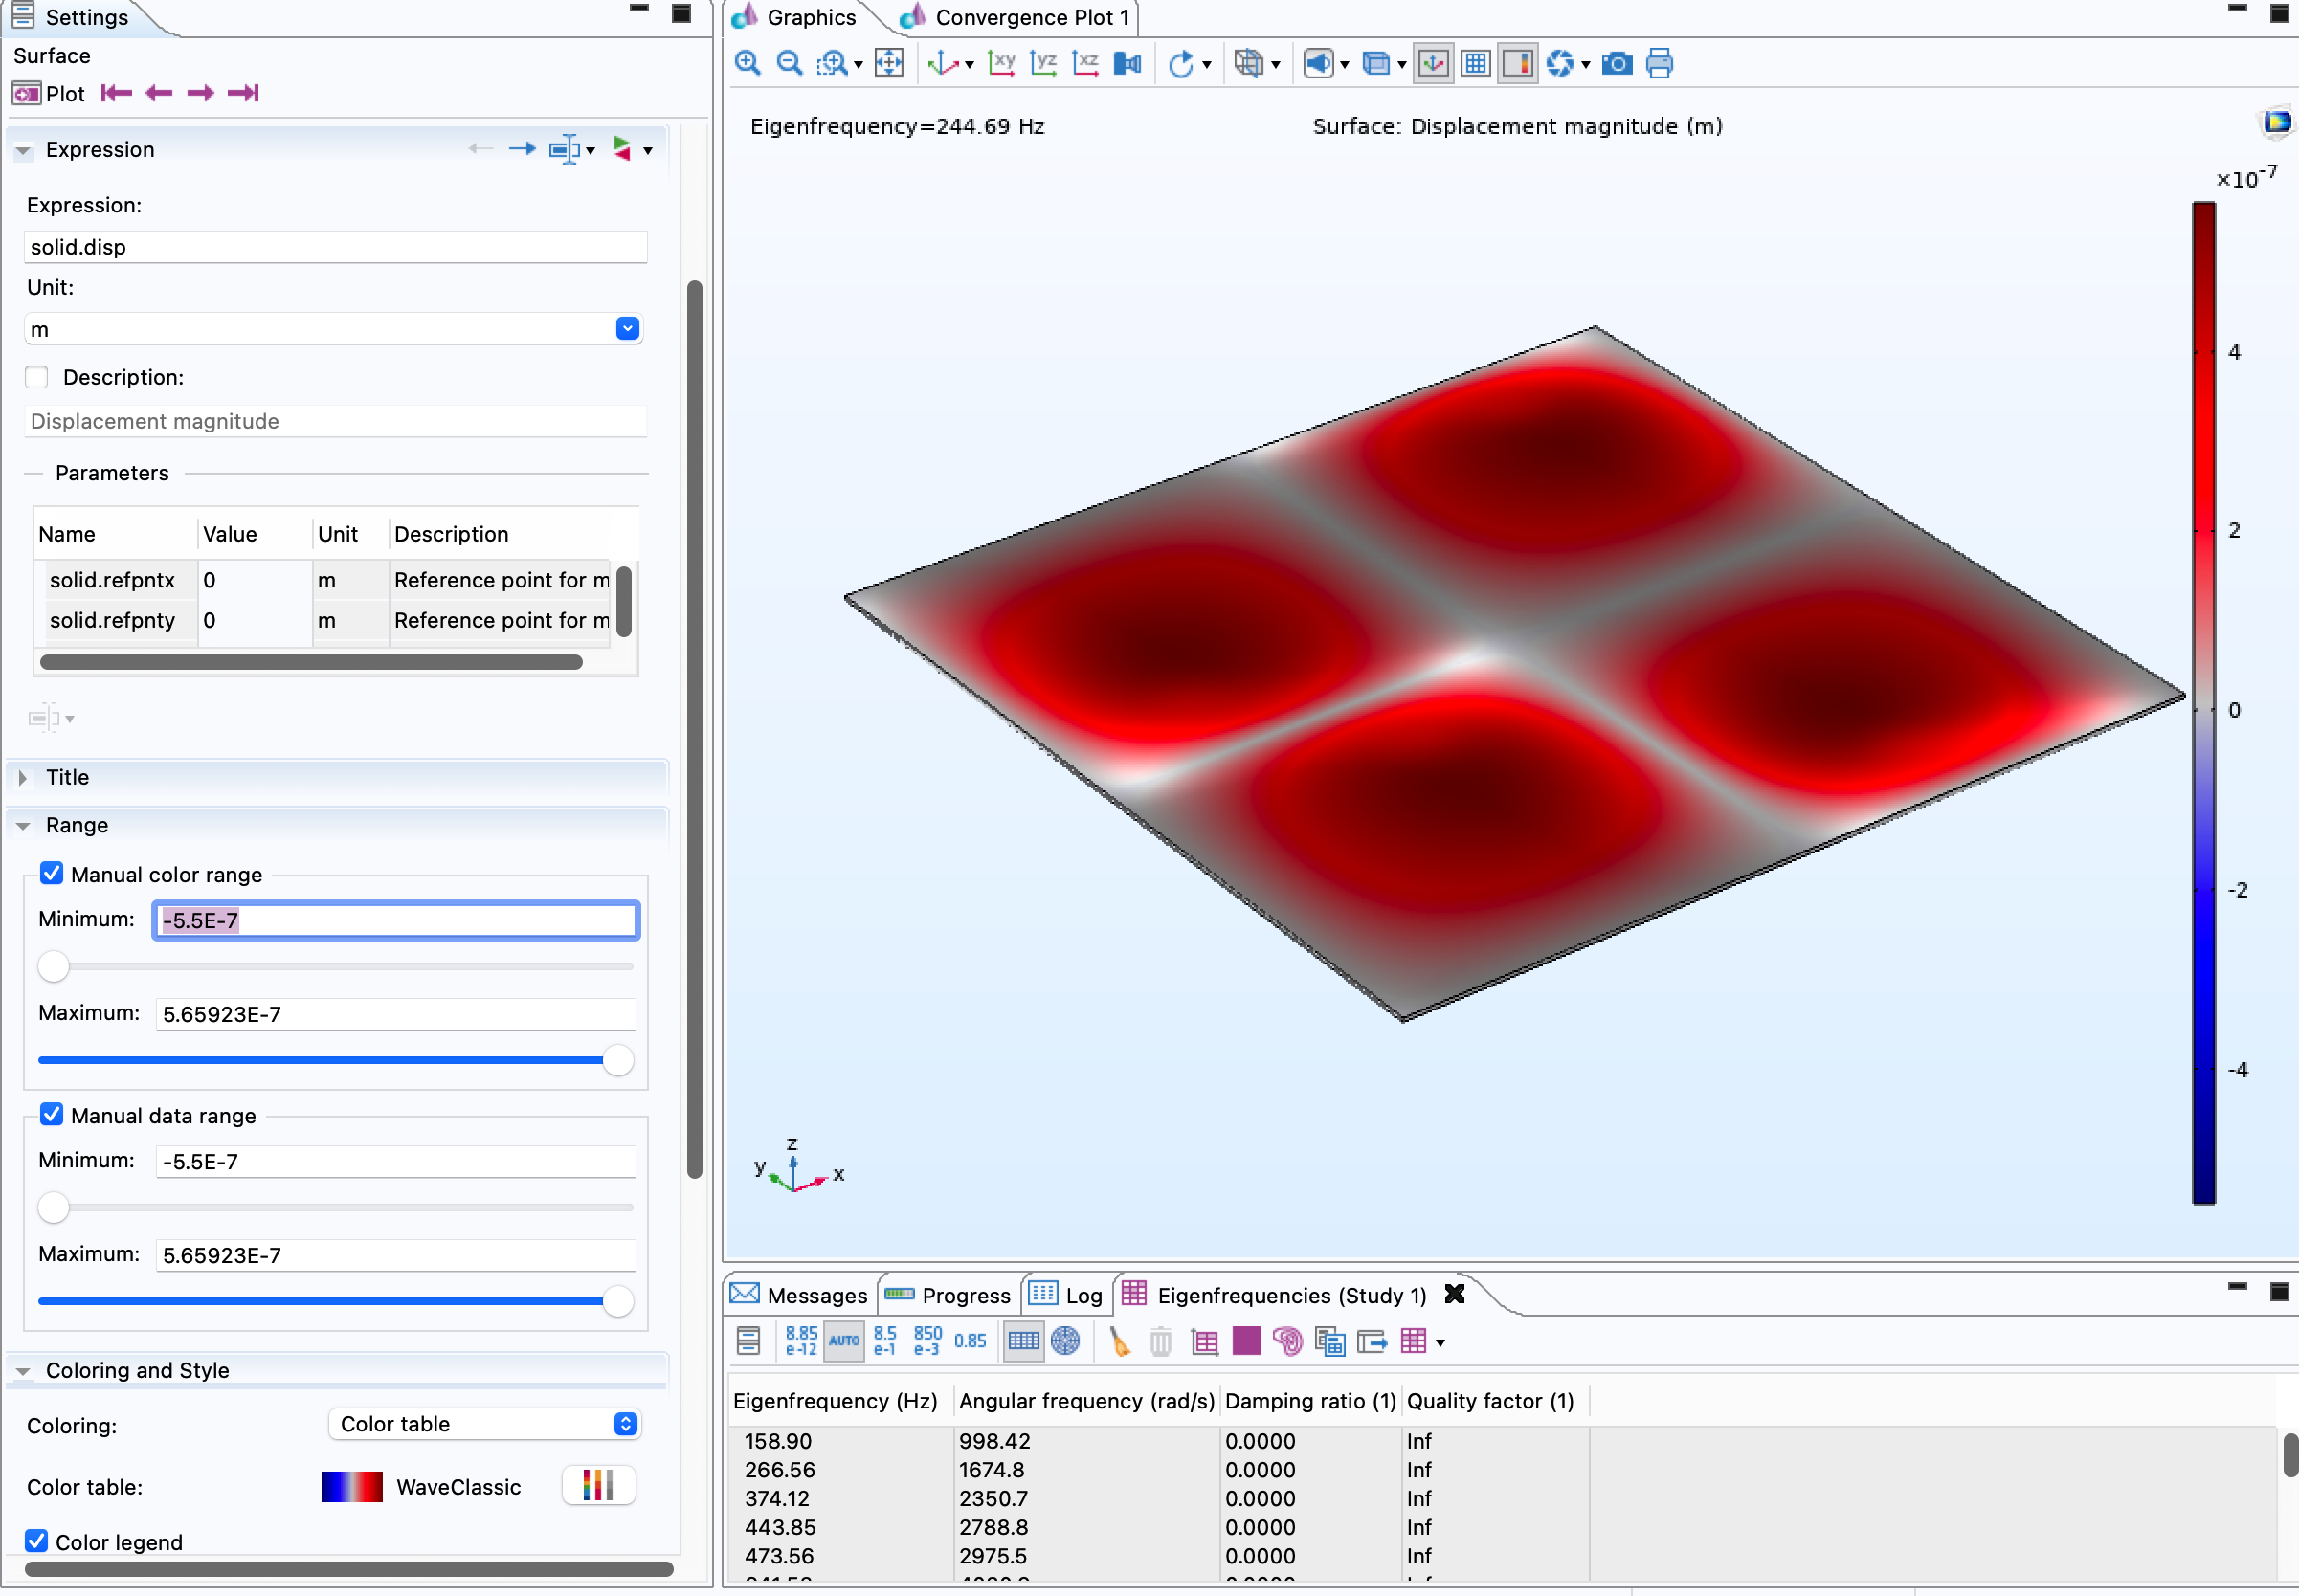
I can figure out how to change the range of the data and the color map to include +/- values, but I cannot figure out how to get the +/- values display colors to match that range.
 Do I need to use a different quantity to plot (instead of "solid.disp" -- if so, what other quantity should I be plotting?) so that I can get the colormap to show different colors for up/down, in/out, or positive/negative directions for a simple 2-D surface? I don't want to have to resort to vectors. I just want a colored result where the colors indicate relative +/-displacement. The example above from the COMSOL blog about using the Twilight color map shows that it must be possible to do what I want to do . . . I just can't figure out how to do it.

 Great software. But there is a rather steep learning curve for a novice.