Millions of people worldwide have pacemakers, and hundreds of thousands more are implanted each year (Ref. 1). Modeling and simulation can help scientists and engineers better understand and optimize pacemaker designs. In this blog post, we discuss modeling the ionic current distribution within a pacemaker electrode.
Pacemakers and Their Electrodes
The human heart is made up of four parts: two ventricles and two atriums. Blood from the body enters through the right atrium and is pumped into the right ventricle. The right ventricle pumps the blood to the lungs so the blood can be oxygenated. The newly oxygenated blood then enters the left atrium and is pumped to the left ventricle. The left ventricle is the strongest chamber, and it pumps blood throughout the body.

Diagram showing the direction of blood flow through a heart without a pacemaker. Image by BruceBlaus. Licensed under CC BY-SA 2.5, via Wikimedia Commons.
Sometimes, however, the heart doesn’t pump the way it should. Pacemakers maintain a person’s heart rate by monitoring the heart’s natural electrical signals and sending out an electric pulse when an abnormality is detected. They are often used to treat bradycardia, a condition in which the heart beats too slowly. Bradycardia often develops due to age, heart disease, and failure of the body’s natural electrical signal to properly reach the heart. Extremely low heart rate can lead to death, so pacemakers are a critical, lifesaving medical device.
Pacemakers serve two different purposes. Some pacemakers are “demand pacemakers”; that is, they supply electric pulses as needed, when they detect an issue. Other pacemakers are “rate responsive”, meaning that their circuitry can also measure breathing rate, blood temperature, and more to determine the patient’s activity level, and then ensure that the heart beats appropriately.
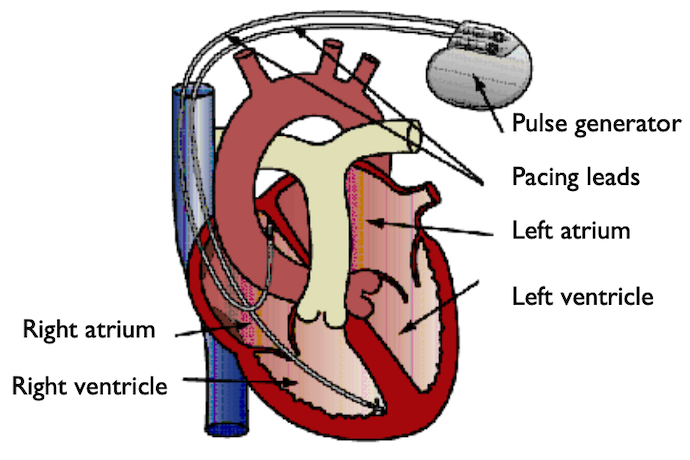
The pulse generator of a pacemaker contains a battery for power and circuitry to determine when pulses are sent out. Wires connect the generator to various parts of the heart. Electrodes are placed at the ends of the wires.
These devices have one to three wires. Pacemakers with single wires are often connected to the right ventricle, pacemakers with two wires are often connected to the right ventricle and atrium, and pacemakers with three wires (“biventricular” pacemakers) are connected to a single atrium and both ventricles.

Schematic of a heart with two electrode pairs, where each pair is made up of one spherical working electrode and one annular counter electrode (see next image).
Virtually every age group uses pacemakers, from infants to the elderly, and each group has different needs. If professionals can model and simulate how pacemakers work, designs can be tested virtually, instead of relying on animal or human experiments. Modeling and simulation is also faster and less expensive than real-world, in vivo pacemaker experiments.
Modeling a Pacemaker Electrode in COMSOL Multiphysics®
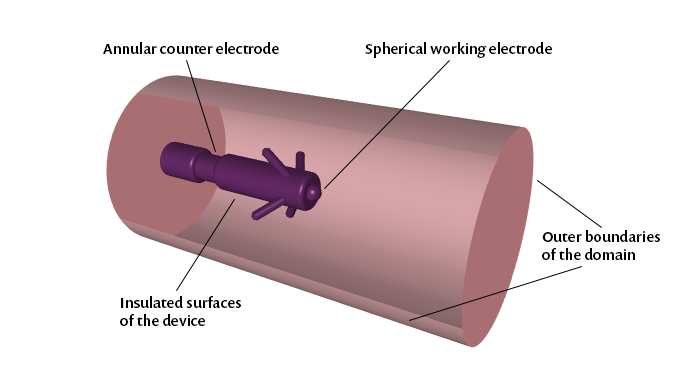
The tutorial model discussed here is not of the entire pacemaker. Instead, we’re modeling the pacemaker’s two electrodes: the cathode (the working electrode) and anode (the annular counter electrode).

Modeling domain and boundary conditions for the pacemaker electrode model.
In our model, the domain is the surrounding blood and tissue, and the electrodes and electrode supports are the model boundaries. The electric current in the domain is controlled by the continuity equation, which follows Maxwell’s equations.
The Electric Currents interface in the COMSOL Multiphysics® software is used for the analysis. You can find more information about this interface in the model documentation.
Results and Discussion
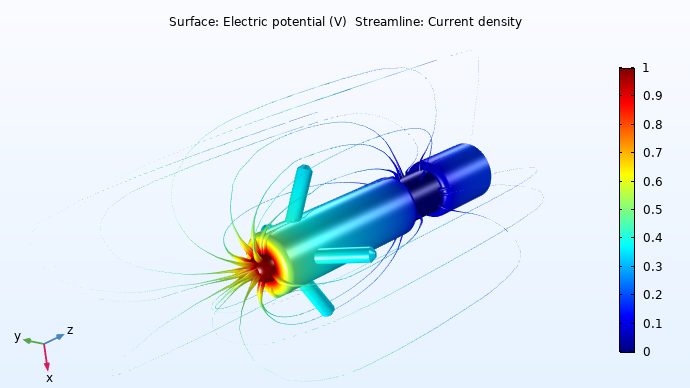
The results shown below give the potential distribution on the electrodes and streamlines of the current distribution inside the heart.

Electrostatic potential distribution on the electrode surface and the total current density (streamlines).
We can see that the current density is highest on the spherical working electrode. The current causes the heart to beat.
Using modeling, engineers can optimize power efficiency and prolong the life of the pacemaker, thus patients would need fewer replacements over time. Engineers could also see how geometry impacts the current and voltage distributions. With simulation, engineers can also perform stress tests to see the limit of a pacemaker design and avoid in vivo experimentation.
While the tutorial model here features a pacemaker, the concepts can be applied to other processes that involve ionic conduction.
Try It Yourself
Check out the Pacemaker Electrode tutorial model by clicking the button below.
Reference
- M. Wood and K. Ellenbogen, “Cardiac Pacemakers From the Patient’s Perspective“, Circulation, vol. 105, no. 18, 2002.


Comments (0)