
The fans in an airplane’s turbofan engine are one of its main sources of noise. In excess, this can cause a range of health problems, including hearing impairment, sleep disturbance, and stress-related illnesses. To optimize the design of turbofan engines to reduce noise pollution and its correlating side effects, you can turn to acoustic modeling. Our jet pipe tutorial model speaks to the benefits of using such an approach.
Why Noise Reduction Is Important in Turbofan Engines
If you’ve ever flown on a commercial airplane, it’s likely that your flight was powered by a turbofan engine. Turbofan engines function by capturing air and sending part of this into a compressor. The compressed air then enters a combustion chamber, where it is ignited with fuel, and then the released products propel the plane forward.
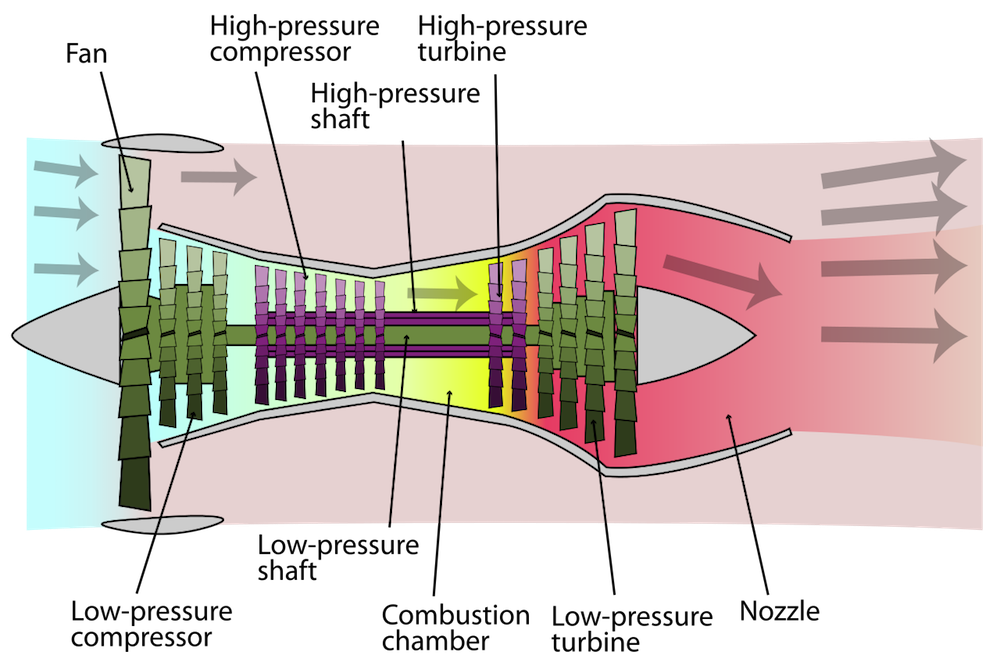
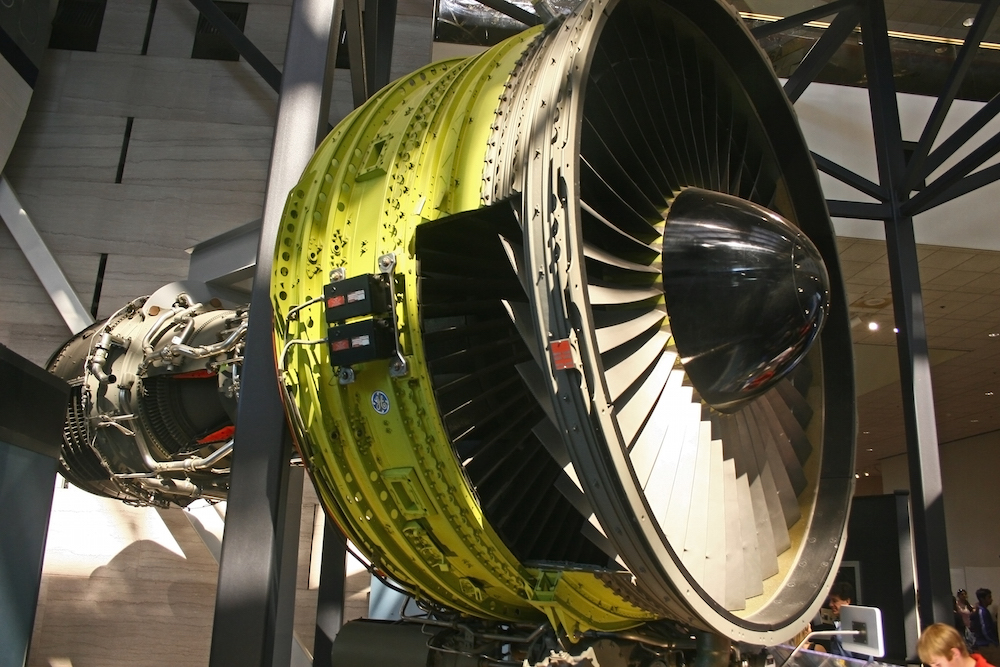
Left: A turbofan engine schematic. Image by K. Aainsqatsi — Own Work. Licensed under CC BY-SA 3.0, via Wikimedia Commons. Right: A real-world turbofan engine. Image by Sanjay Acharya — Own Work. Licensed under CC BY-SA 3.0 via Wikimedia Commons.
In recent years, the design of turbofan engines have vastly improved, with a particular emphasis on noise reduction. To understand why, consider once again being a passenger on a flight — it can be rather unpleasant to listen to a loud engine. And for those people who live near airports, loud noise from planes as they land and take off can disturb sleep patterns. Reducing the noise generated by airplanes and their engines has therefore been a key point of focus in the aviation industry.
Reducing the excess fan noise that comes from turbofan aeroengines offers one potential solution to this issue. In the COMSOL Multiphysics® software, you can analyze and optimize the radiated noise from a turbofan engine to meet such goals. To learn more, let’s take a look at our simplified tutorial model of a jet pipe.
Improve Your Turbofan Engine Design by Analyzing Fan Noise
To analyze a turbofan aeroengine, we can focus on specific elements of its design. In this case, we’ll investigate the radiation of fan noise generated by a turbofan aeroengine’s annular duct. Let’s start by looking at our axisymmetric model geometry, which has a symmetry axis at the engine’s centerline. The model geometry mimics the outlet nozzle of the jet engine (see the schematic above). The gray area in the following schematic represents the interior of the engine in the nozzle. The model obviously uses a very simplified geometry and focuses on the physical principles and model setup.
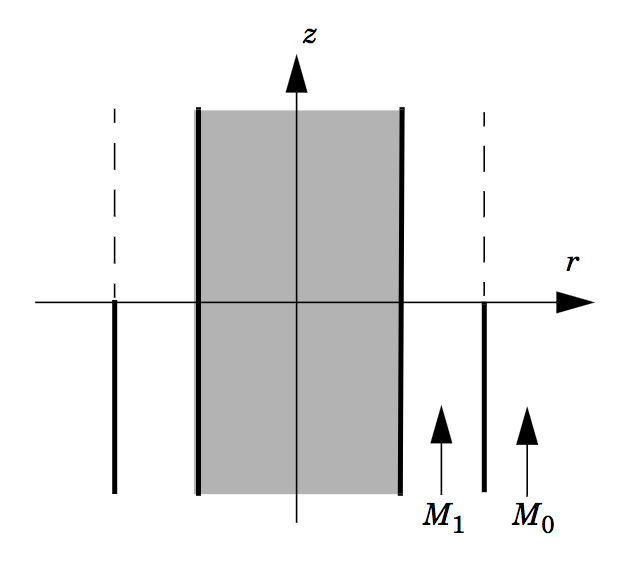
Turbofan motor geometry. The gray zone indicates the internal machinery of the engine. Air flows through the jet (M1) as well as around the jet (M0).
In this model, air flows inside and outside of the duct as uniform mean flows with a Mach number of M1 = 0.45 inside and M0 = 0.25 outside, respectively. This corresponds to the red and pink regions in the initial schematic of the turbofan engine. Since the air surrounding the engine moves at a slower speed than inside the jet, a vortex sheet (indicated by the dashed lines in the image above) results in the jet stream, which separates the air flows along the extension of the duct’s wall. Using our model, we can calculate the near-field flow on both sides of the vortex field.
When solving our jet pipe model, we used the Linearized Potential Flow, Frequency Domain interface in the Acoustics Module to describe acoustic waves within a moving fluid. It’s important to note, however, that the field equations are valid only when working with an irrotational velocity field. Since this is not the case across a vortex sheet, the sheet has a discontinuous velocity potential. To model such discontinuity, we applied the built-in Vortex Sheet boundary condition on the interior boundaries. As for the acoustic field within the duct, we described this element using the sum of the eigenmodes propagating within the duct and then radiating into free space. This is a common approach when setting up sources in this type of simulation.
For our study, we utilized a boundary mode analysis to find the inlet sources. The first step was to investigate circumferential wave numbers (m = 4, 17, and 24) and generate various eigenmodes that correspond to different radial mode numbers. The second step was to use three eigenmodes as incident waves inside the duct: (m,n) = (4, 0), (17, 1), and (24, 1). The results indicate that the largest eigenvalue for a given m corresponds to the radial mode n = 0. The smallest eigenvalue, meanwhile, corresponds to n = 1.
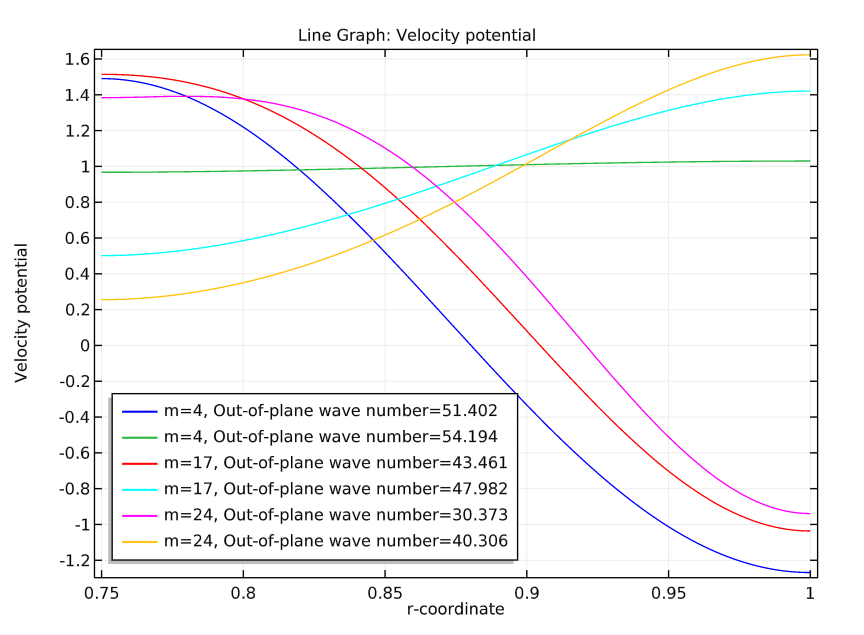
Plot of the eigenmodes featuring circumferential mode shapes m = 4, 17, and 24 and radial modes n = 0 and 1.
As part of our analysis, we also investigated the source velocity potential. As depicted in the plot below, we used a revolved geometry that included the circumferential wave number contribution to see its spatial shape.
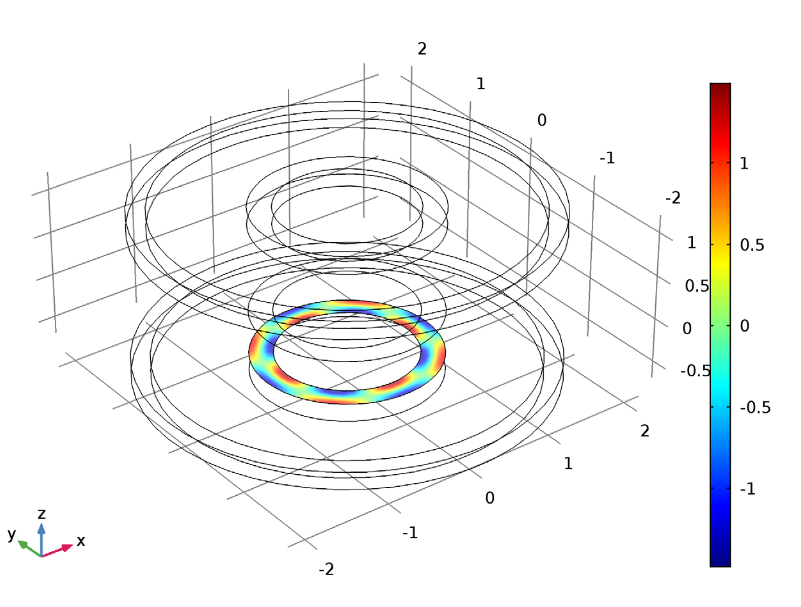
Model showing a boundary mode of (m, n) = (4, 0).
Comparing Our Simulation Results to Existing Literature
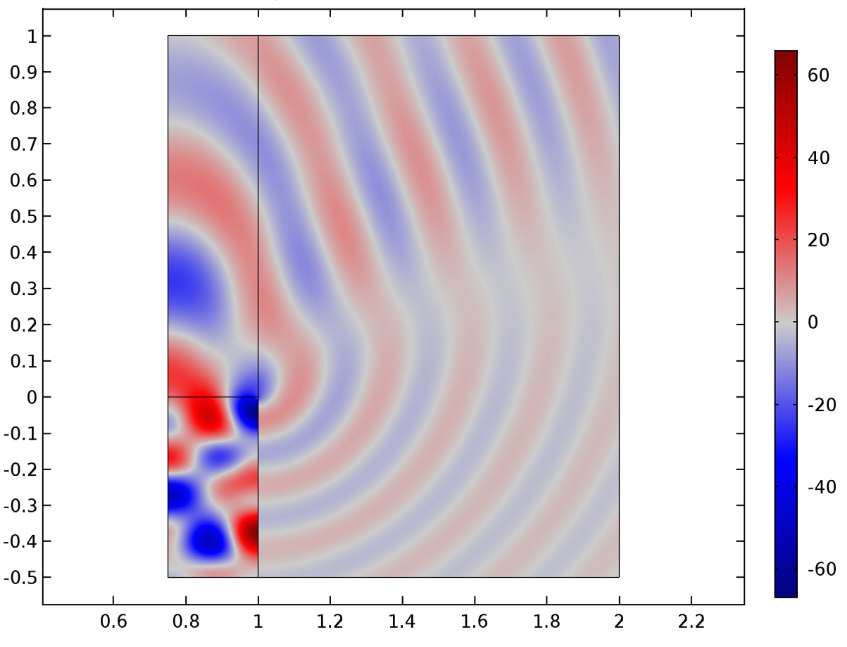
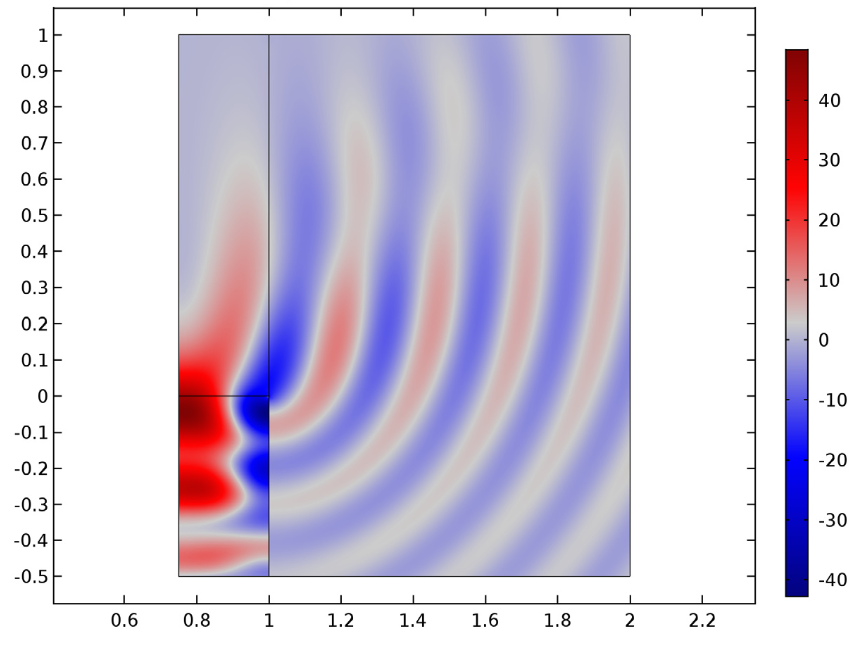
To gain further confidence from the results of our analyses, we compared our simulation findings to those results presented in the paper “Theoretical Model for Sound Radiations from Annual Jet pipes: Far- and Near-field Solution” (see Ref. 1 in the model documentation). The plots below, for instance, showcase the near-field pressure from different source eigenmodes in our simulation study. All of the results are solved for a Mach number of M1 = 0.45 inside the pipe and M0 = 0.25 outside of the pipe.
From left to right: The near-field solution for (m, n) = (4, 0), (17, 1), and (24, 1).
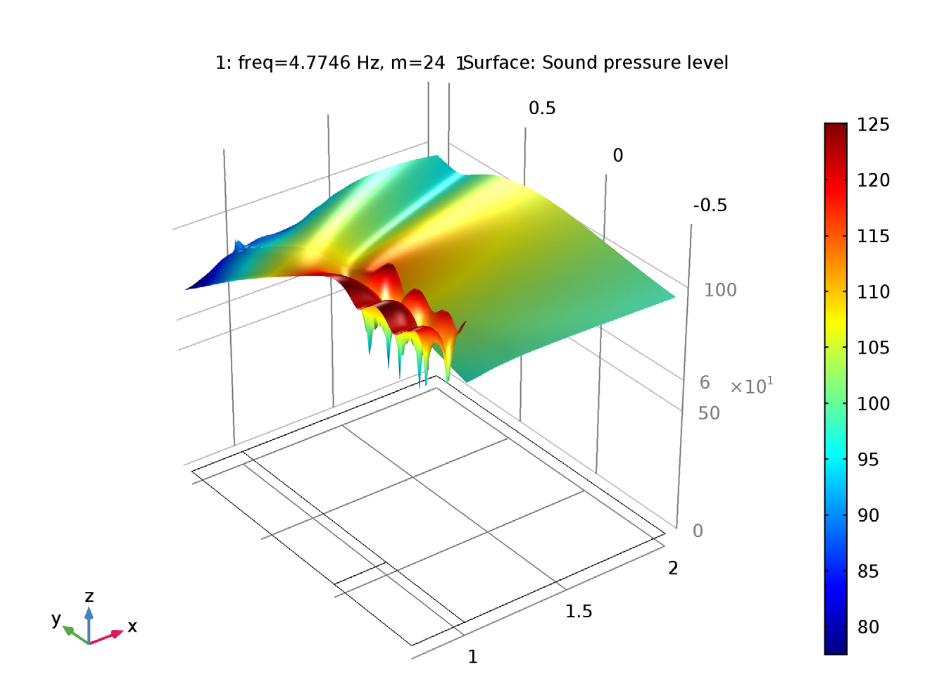
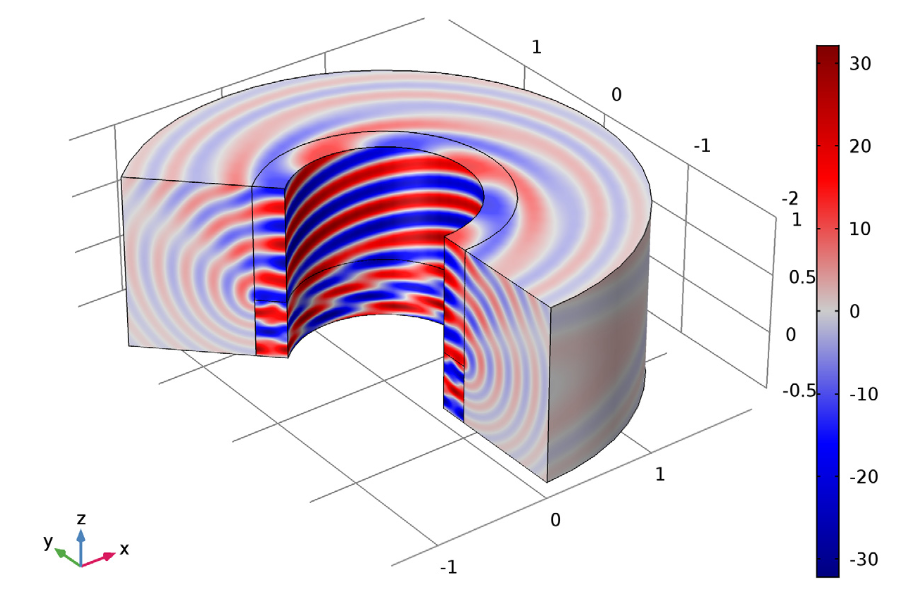
Further, we analyzed the near-field sound pressure level and the revolved geometry’s near-field pressure. The results from these studies are highlighted in the plots below, respectively.
Left: Near-field sound pressure level for (m, n) = (24, 1). Right: Near-field pressure shown in the revolved geometry for (m, n) = (4, 0).
By comparing our findings to the established literature highlighted above, we were able to further confirm the validity of our results. Such accuracy speaks to benefits of using COMSOL Multiphysics to help reduce noise pollution in turbofan engine designs and thus facilitate important advancements within the aviation industry.
Learn More About Modeling Aeroacoustic Designs in COMSOL Multiphysics®
- Try the Jet Pipe tutorial model that was presented here
- Read more aeroacoustics posts on the COMSOL Blog:




Comments (0)