

Alkaline water electrolyzers produce the majority of the world’s clean hydrogen. Modeling and simulation can help designers better understand these electrolyzers by providing insight into the various electrochemical and transport phenomena involved as well as the design and operating parameters. In this blog post, we’ll go through an example model of an alkaline water electrolyzer setup and highlight how the COMSOL Multiphysics® software can be used to investigate different aspects of the model, including the current and temperature distribution.
The Use of Green Hydrogen in Industry
In the production of clean hydrogen, or “green hydrogen”, alkaline water electrolyzers are most common thanks to the ease with which they can be scaled up (thanks largely to simple production equipment and a stable and noncorrosive electrolyte) and their inexpensive materials compared to other types of electrolyzers. Further increasing their attractiveness, these devices can also tolerate a wider range of impurities in their feedwater than other electrolyzers.
However, in the hydrogen industry, while electrolyzers are currently the top choice for green hydrogen production, green hydrogen only makes up less than 1% of all hydrogen production, as compared to the production of other, less sustainable types of hydrogen. The reason why hydrogen production through water electrolysis is relatively low is the higher investment and operating costs compared to steam-methane-reforming processes. The operating costs are largely dependent on the cost of electricity, which means that in some countries with low electricity cost, electrolysis is a more competitive technology. The investments costs can be lowered with the production volume, if the technology is utilized more. Modeling and simulation can be used to study and optimize the design and operating conditions in order to lower the electric energy consumption in the process. In addition, modeling and simulation can reduce the need for prototypes at the lab, pilot, and full scale, lowering the development costs and eventually the total investment costs.
Exploring a Zero-Gap Example Model
This model is set up using the Fuel Cell & Electrolyzer Module, an add-on product to COMSOL Multiphysics. The model is named “Two-Phase Nonisothermal Zero-Gap Alkaline Water Electrolyzer” and is available in the add-on’s Application Library. The purpose of the model is to investigate how the current and temperature distribution in the electrolysis cell is impacted by the distribution of gas bubbles in the electrolyte.
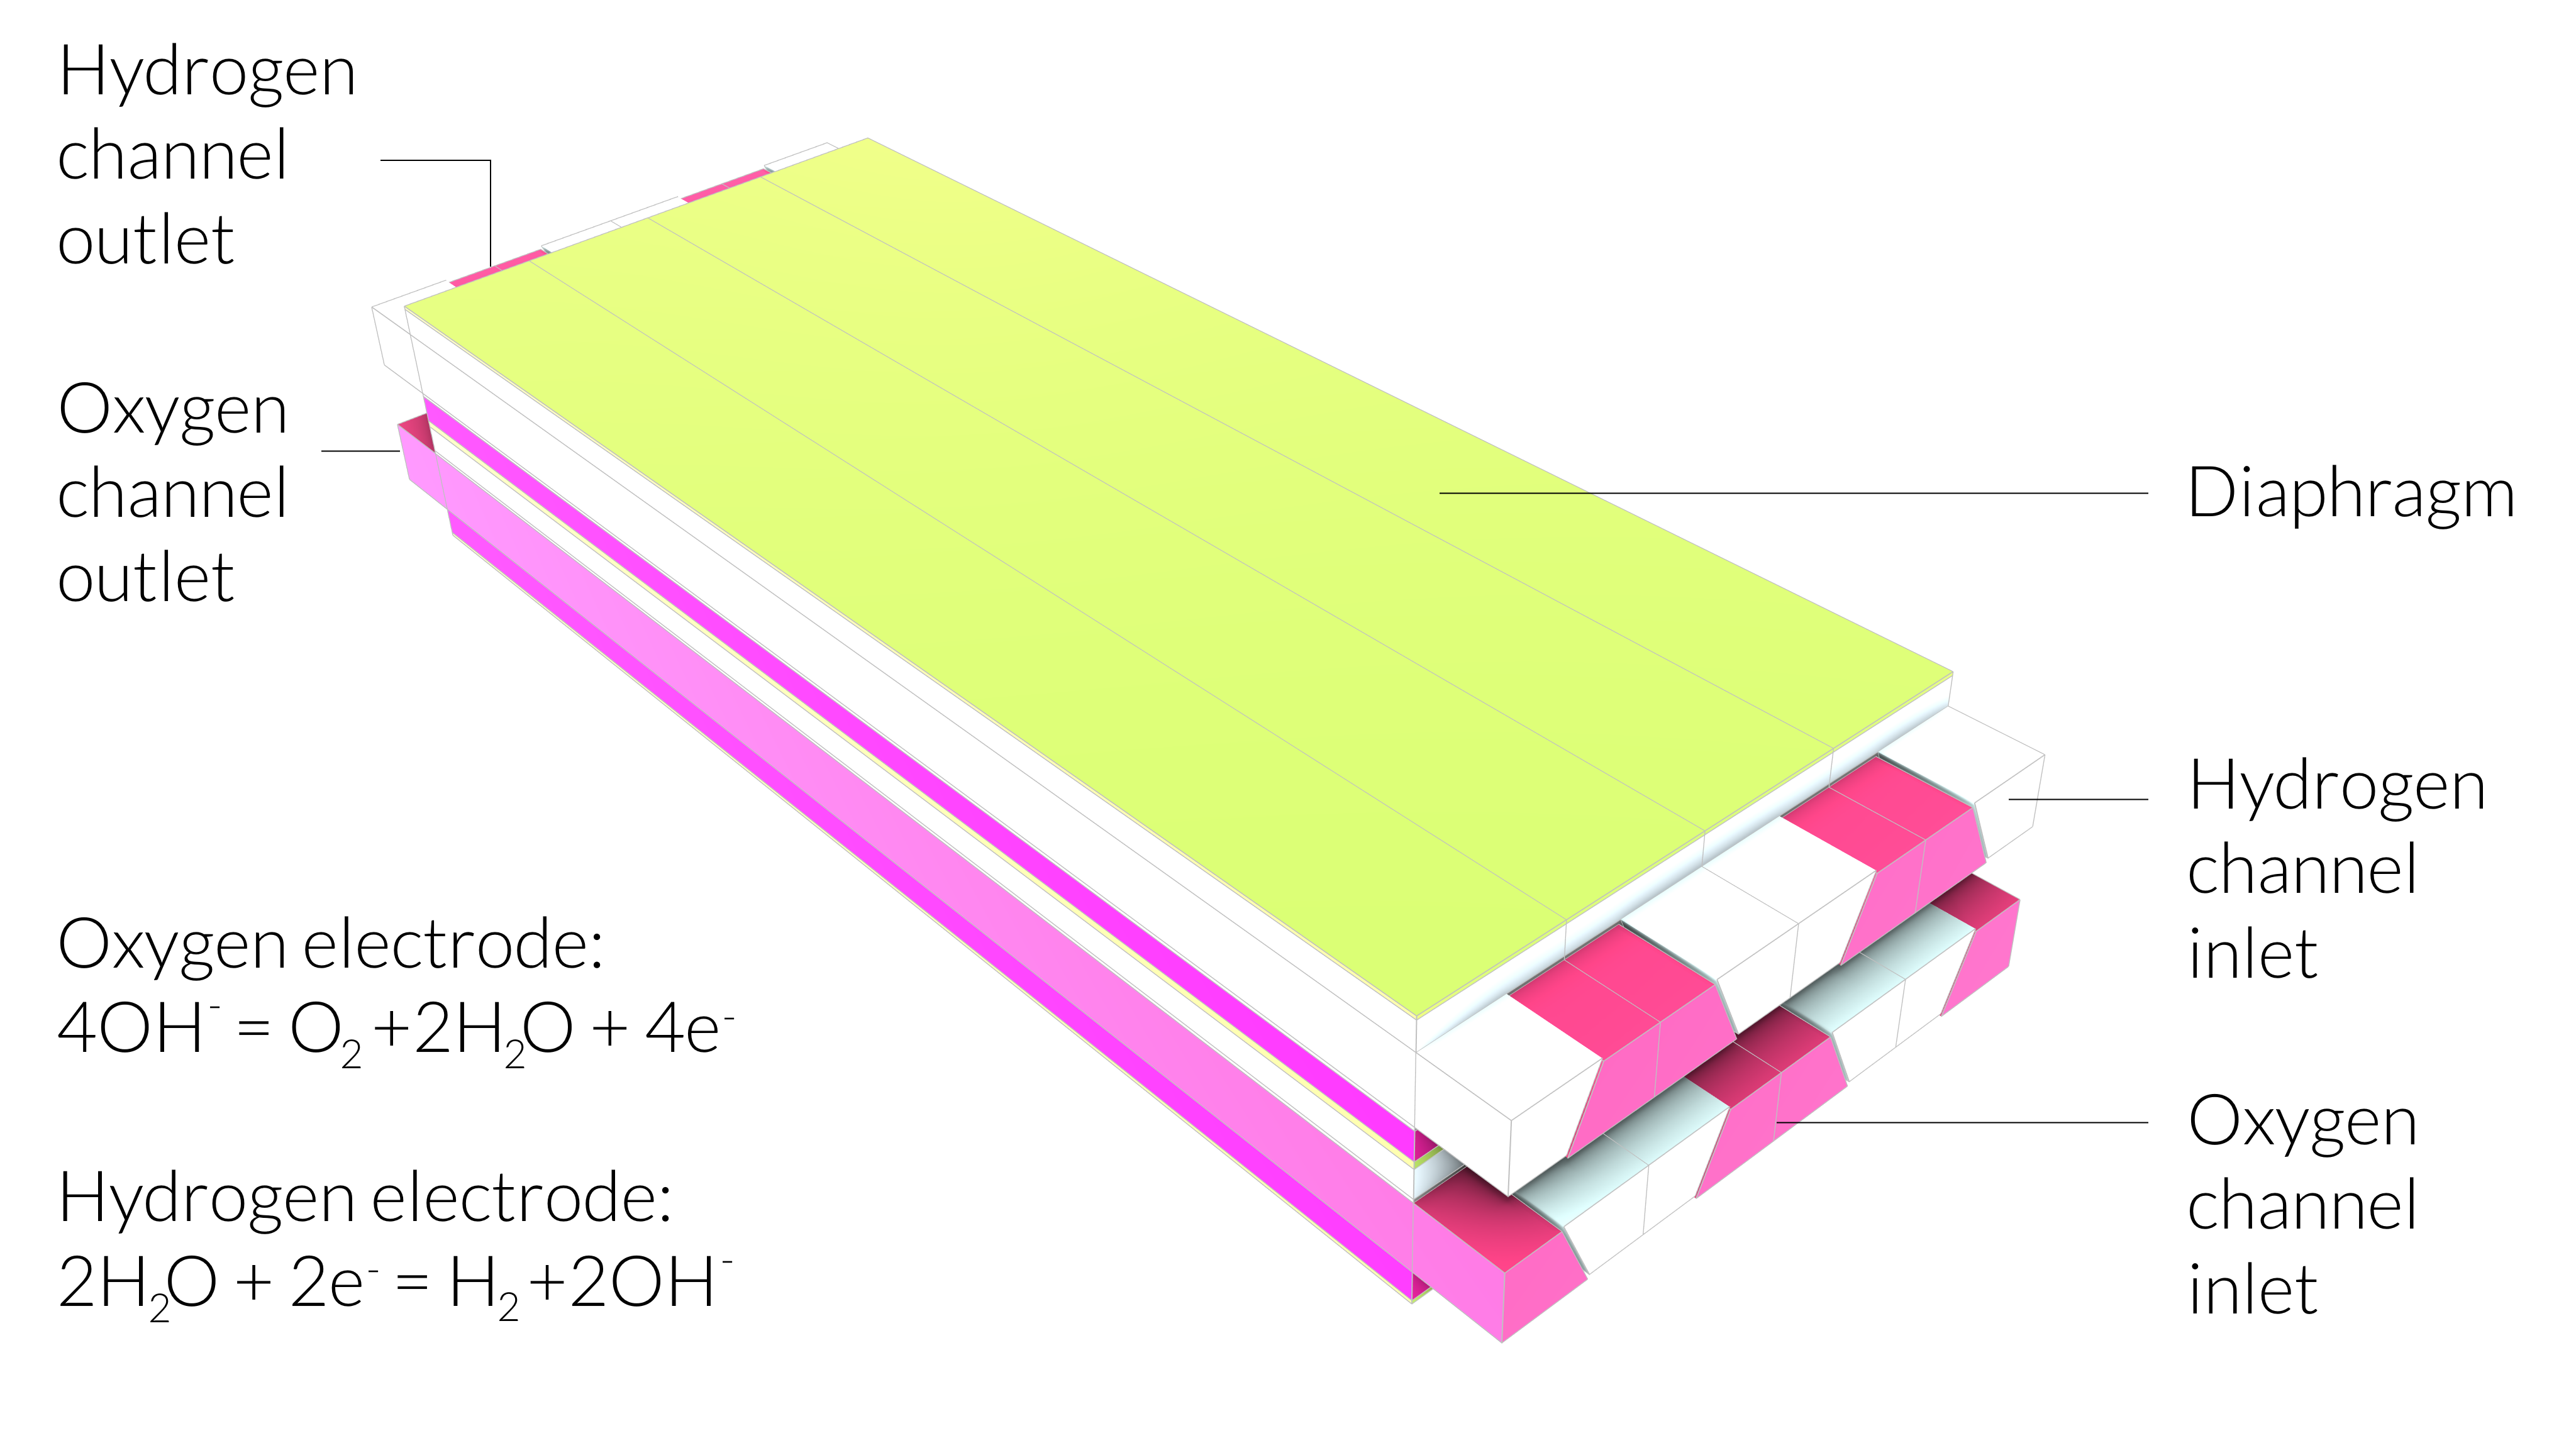
The geometry defines a geometric unit of an electrolyzer stack, which incorporates two electrolysis cells that are separated by a corrugated bipolar steel plate and extend 10 cm along the channel direction. The model features a potassium hydroxide (KOH) electrolyte that is 6 M, and the porous gas diffusion electrodes (GDEs) are pressed against the cell separator. (An in-depth look at the model setup can be found in the model documentation, which can be accessed via the button at the end of this blog post.)
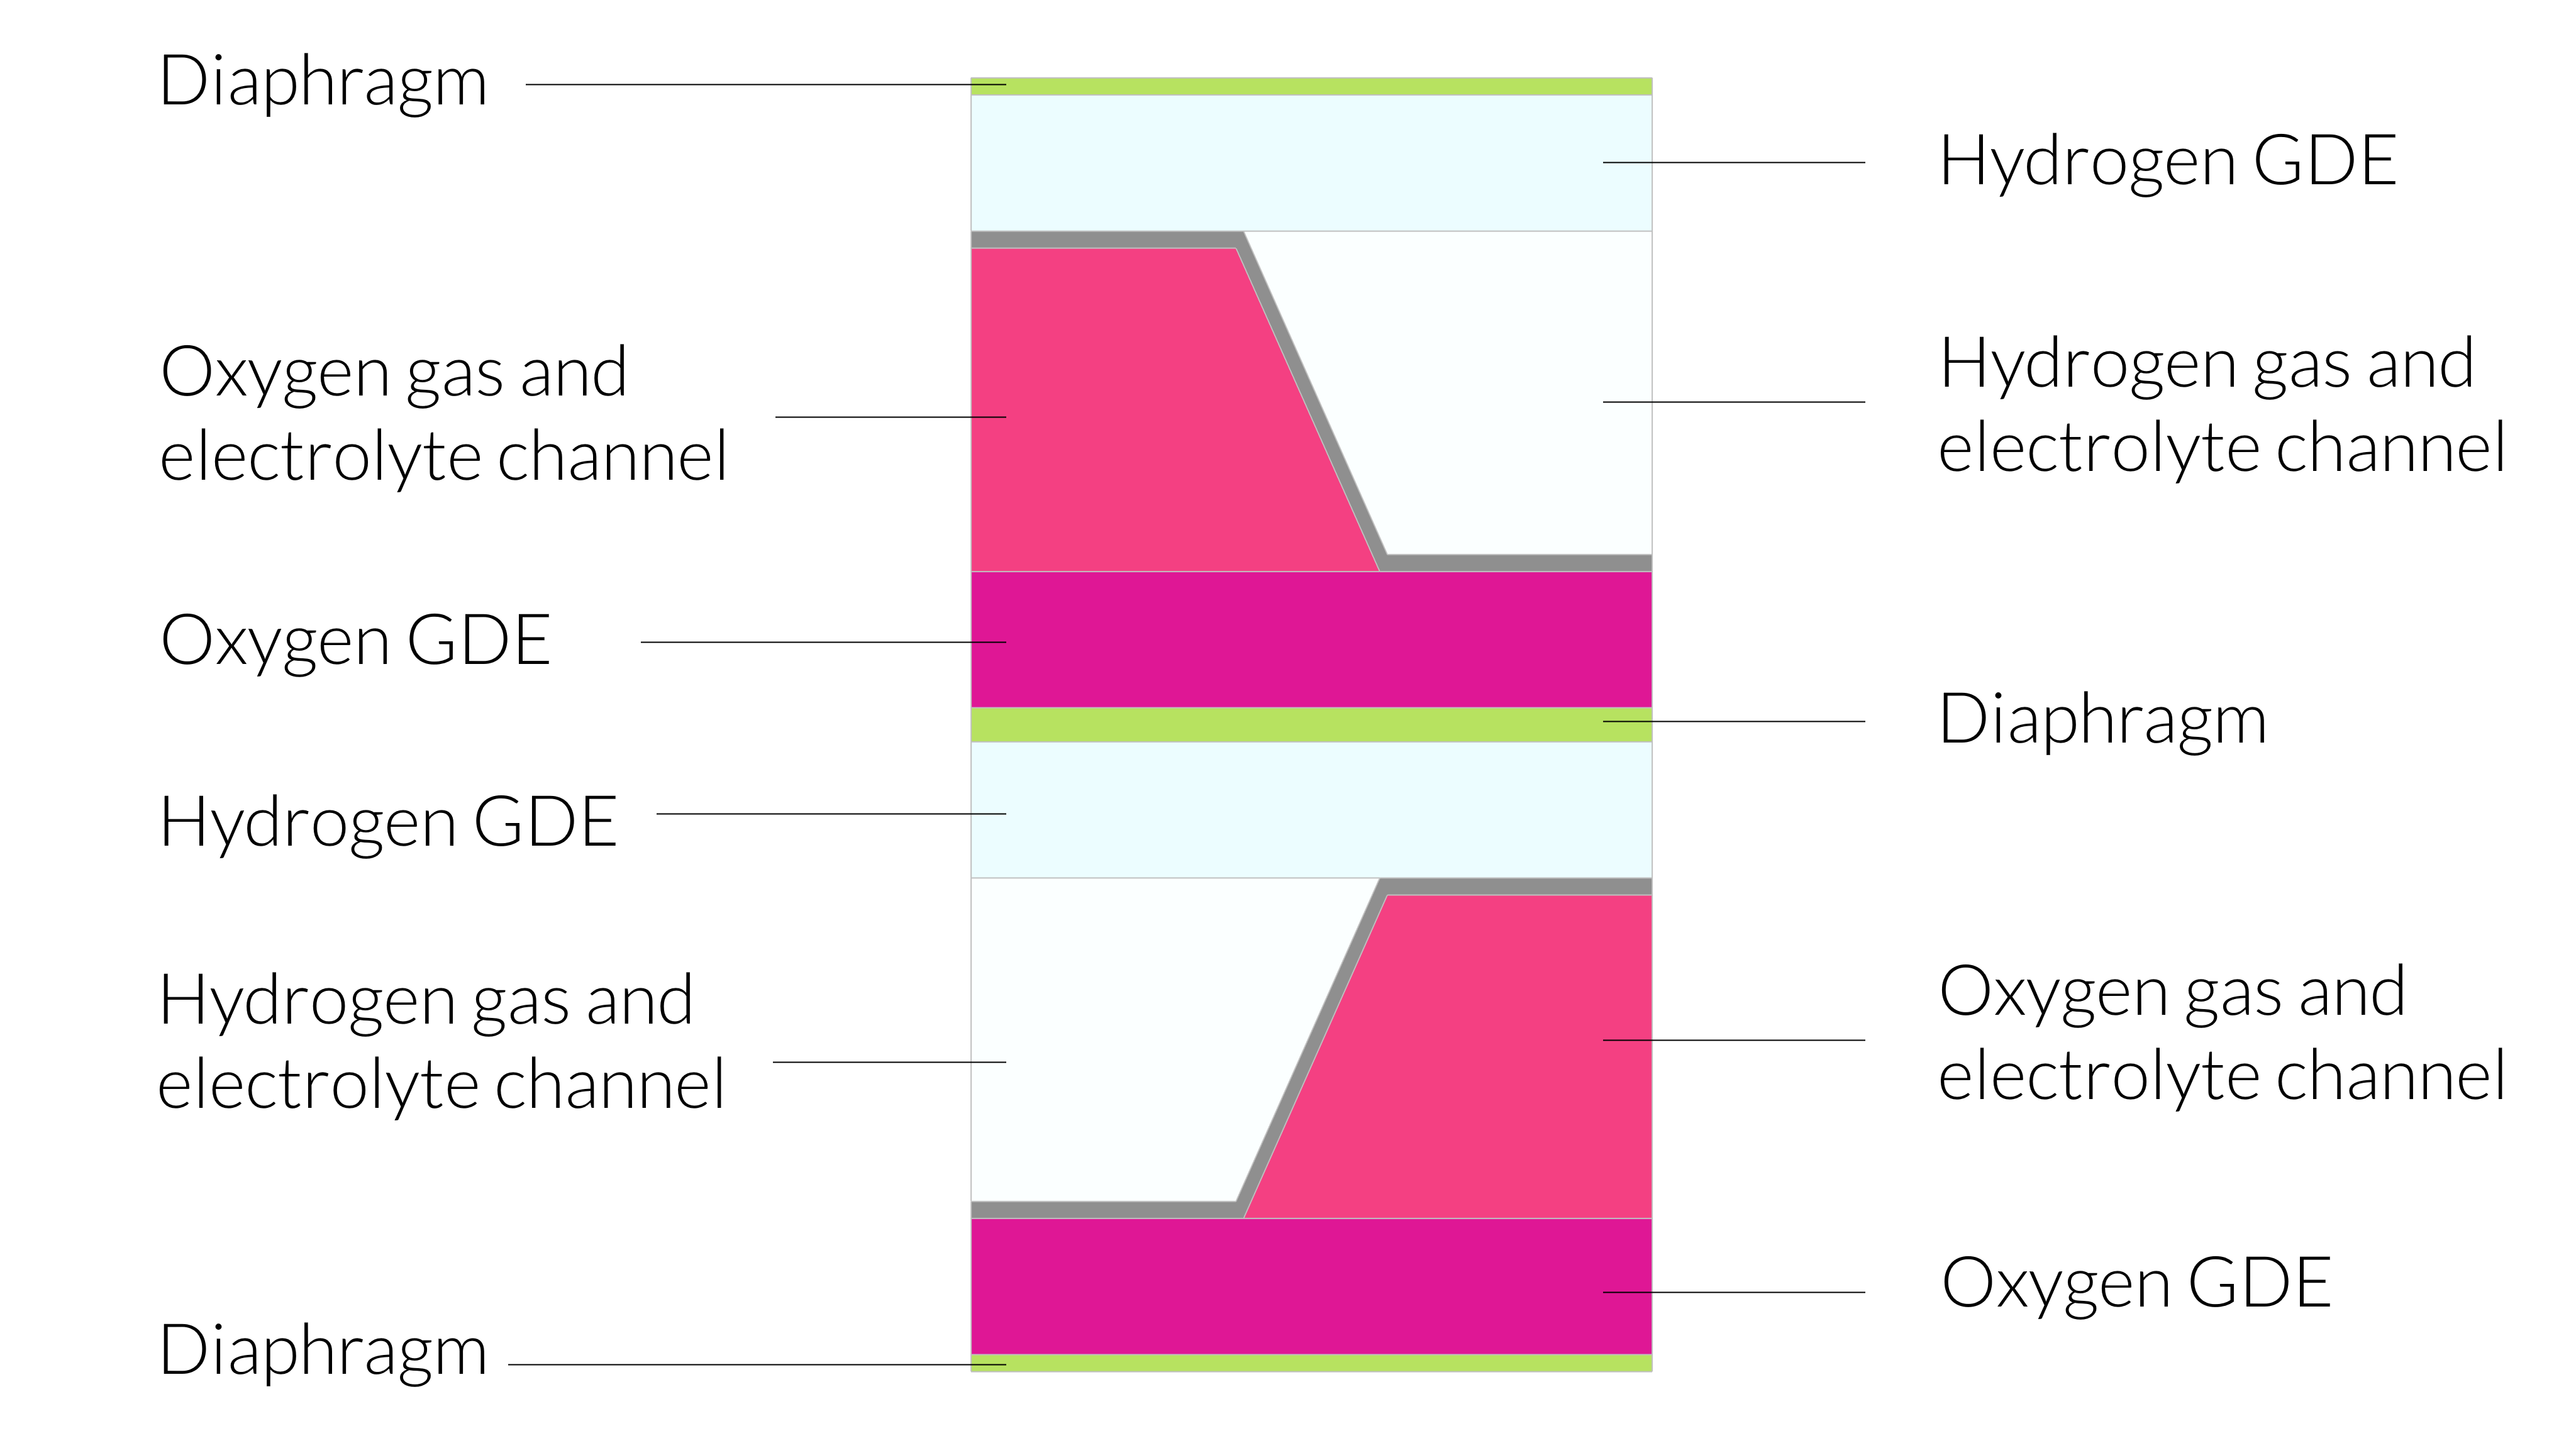
Left: The cross section of a unit cell of the alkaline water electrolyzer model. Right: By extruding and mirroring the cross section, we can see how the geometry may represent a unit cell in a stack. Stacking them in the vertical direction would create a stack.
The geometric unit can be repeated in the vertical direction using periodic conditions and mirrored in the horizontal direction using symmetry conditions; see the figure above. In the geometric unit, we have three diaphragm domains: one placed in the middle of the cell, one at the bottom, and one at the top. The top and bottom diaphragms have half the thickness of the one in the middle; the stacking results in the middle diaphragm having the full thickness. The corrugated bipolar plates separate the gas-electrolyte channels for oxygen and hydrogen, respectively, and press the oxygen electrode, diaphragms, and hydrogen electrode between the narrow surfaces of the corrugated plates. The oxygen and hydrogen electrodes are GDEs, which means that the electrochemical reactions are distributed along the thickness of the electrodes, depending on the electrode kinetics and the pore electrolyte conductivity.
The goal with the design is to avoid the entrainment of gas inside the GDEs so that the gas produced at the electrode surfaces escapes as fast as possible away from the electrodes and the diaphragm. Since gas bubbles shield the electrode surface, removing them from the surface as soon as they are produced makes the surface available for the current and lowers the activation overpotential (lowers electricity consumption). In addition, bubbles that are trapped inside the electrode and between the electrode and the diaphragm lower the conductivity and the supply of fresh electrolyte, further increasing the ohmic and concentration overpotentials (increases the energy consumption). In this model, neither the surface blockage nor the electrolyte concentration (which is assumed constant) are accounted for. So, the remaining effect is that gas bubbles lower the conductivity of the pore electrolyte in the GDEs, thus increasing the electrode overpotential.
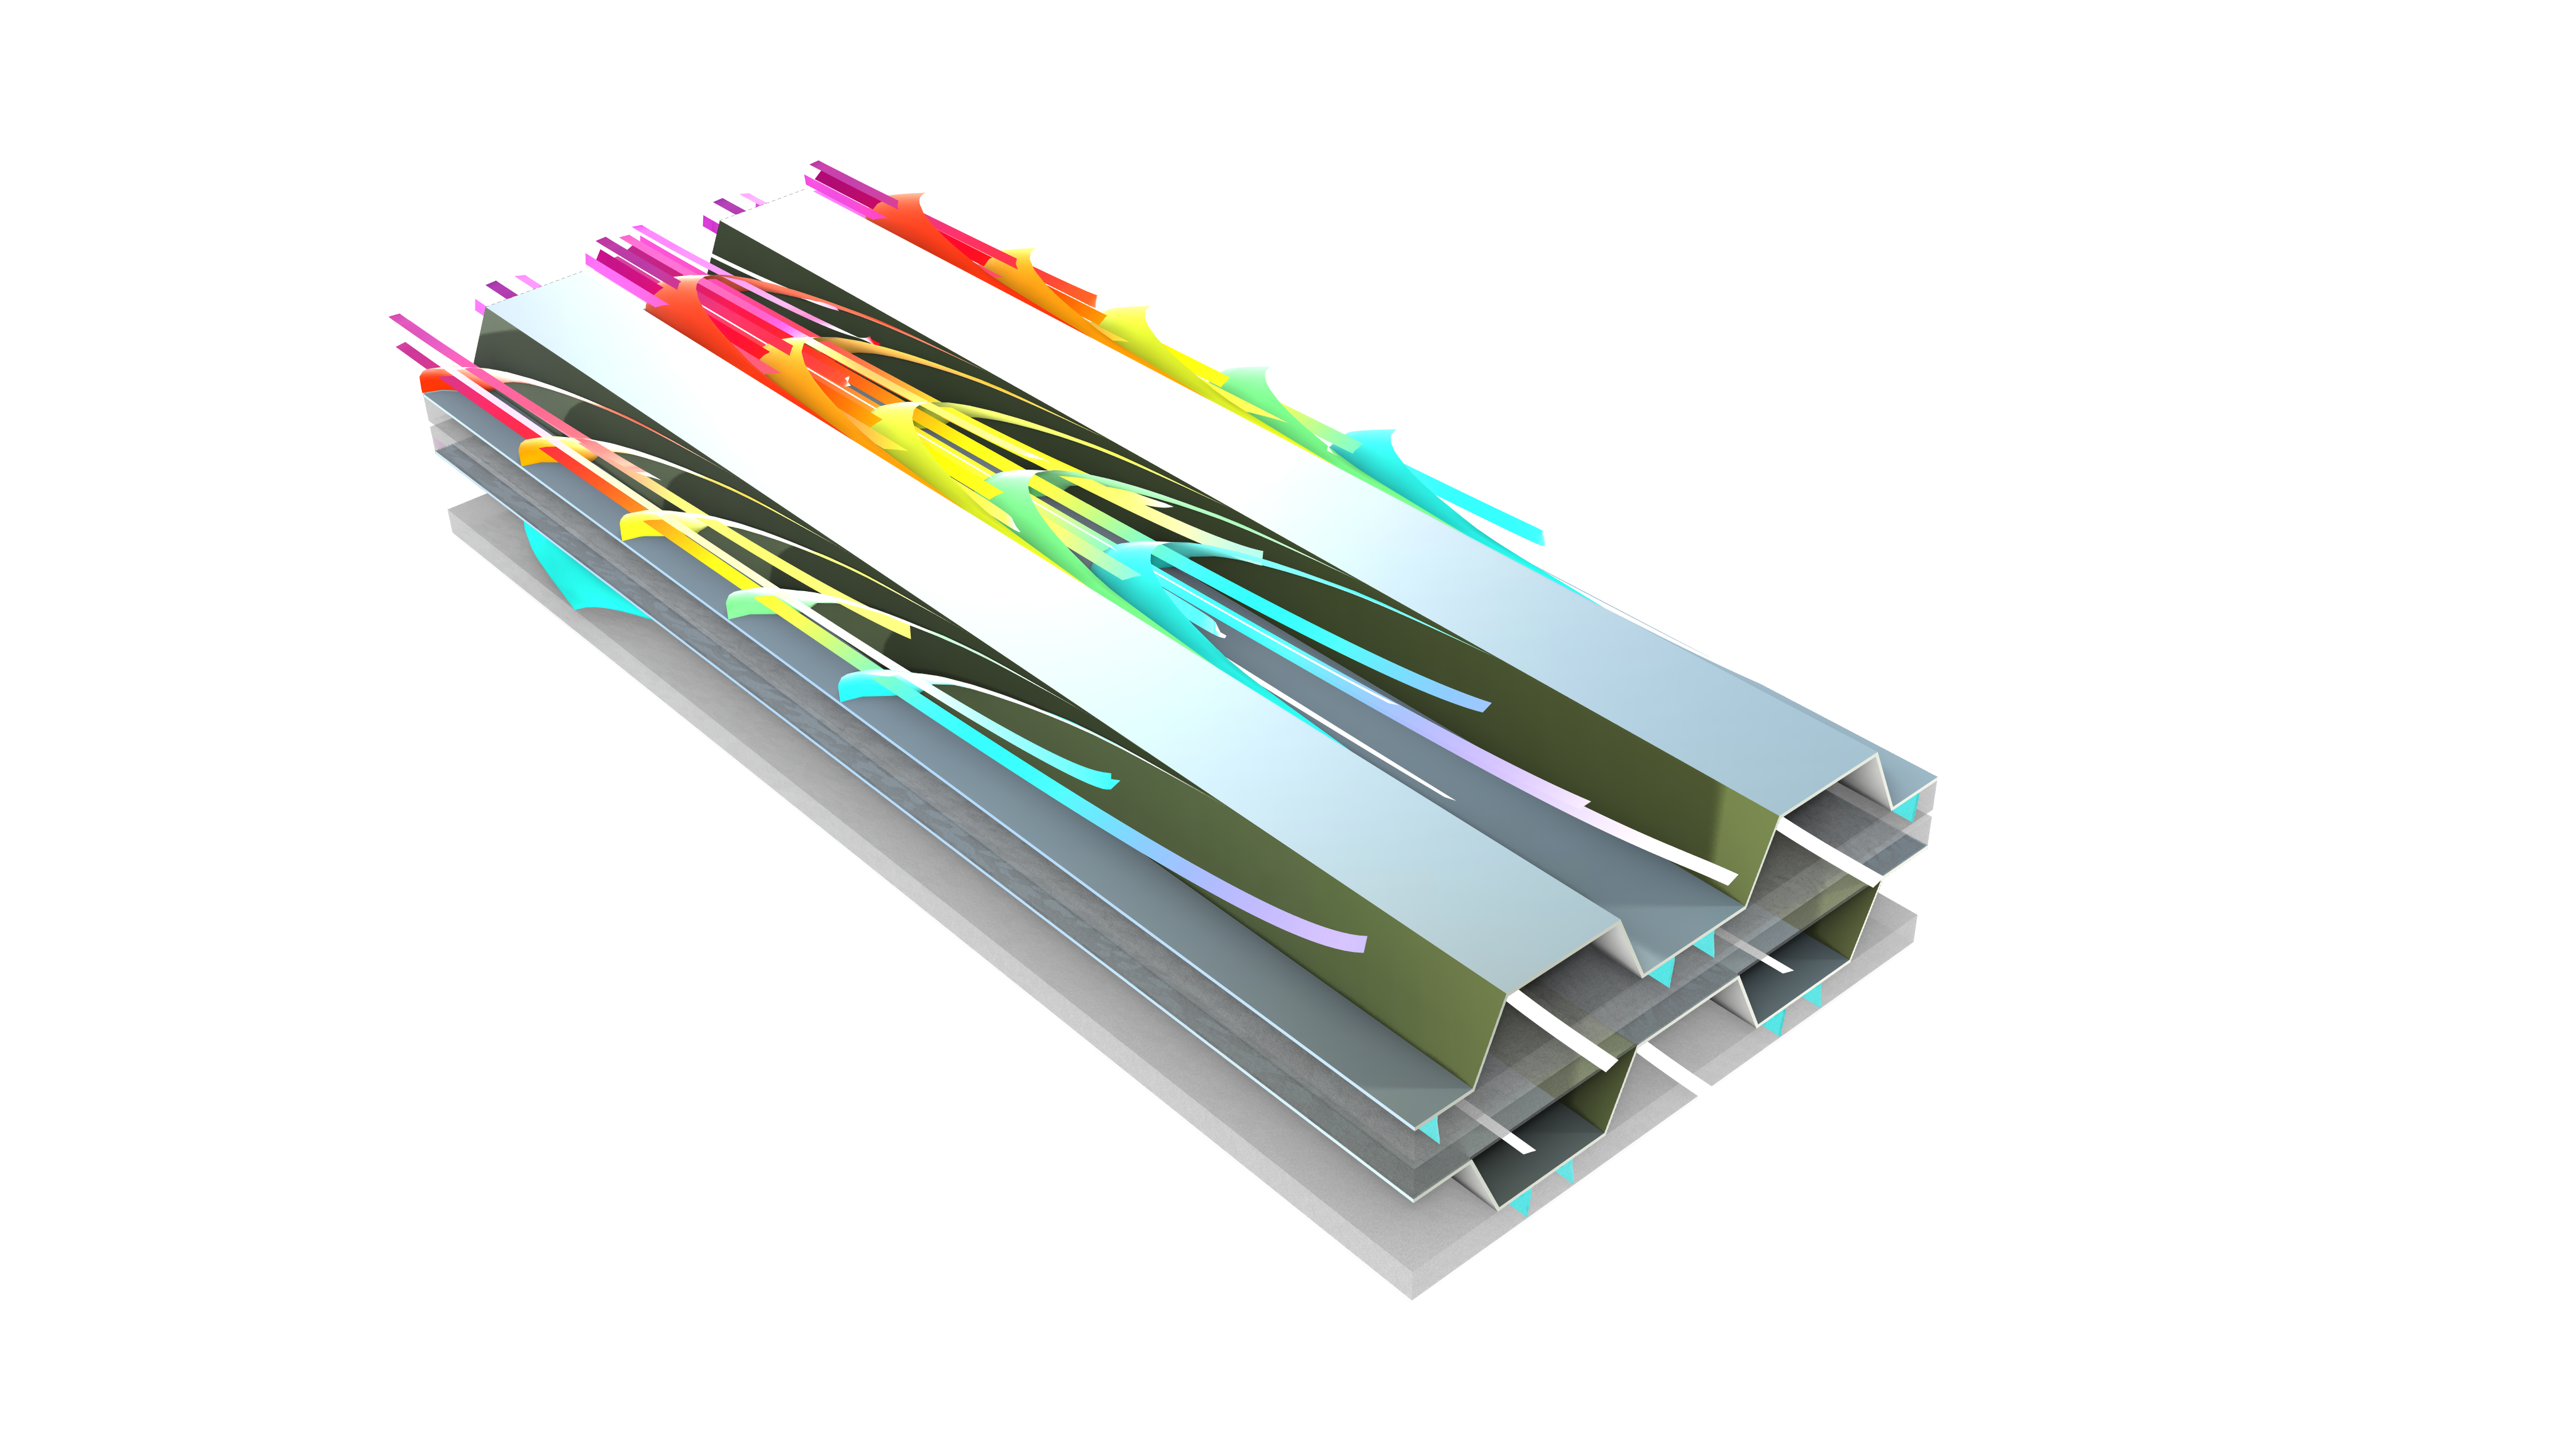
The example alkaline water electrolyzer, showing the gas streamlines and the gas content isosurfaces in the flow channels. Here, we can see the corrugated bipolar plates that separate the gas and electrolyte channels for hydrogen and oxygen, respectively (compare with the left-hand image in the first figure).
Modeling Results
Solving the model equations allows for a multitude of views into this design as hydrogen and oxygen are produced. For instance, different plots can be created for the four following effects in order to better understand the impact of the operating conditions and the design:
- Gas volume fraction in the electrolyte channels
- Gas volume fraction in the pore electrolyte in the electrodes
- Current density distribution in the diaphragm
- Temperature distribution in the cell
In the plots below, the cell voltage is 2.1 V, while the average current density is around 4.2 A/cm2.
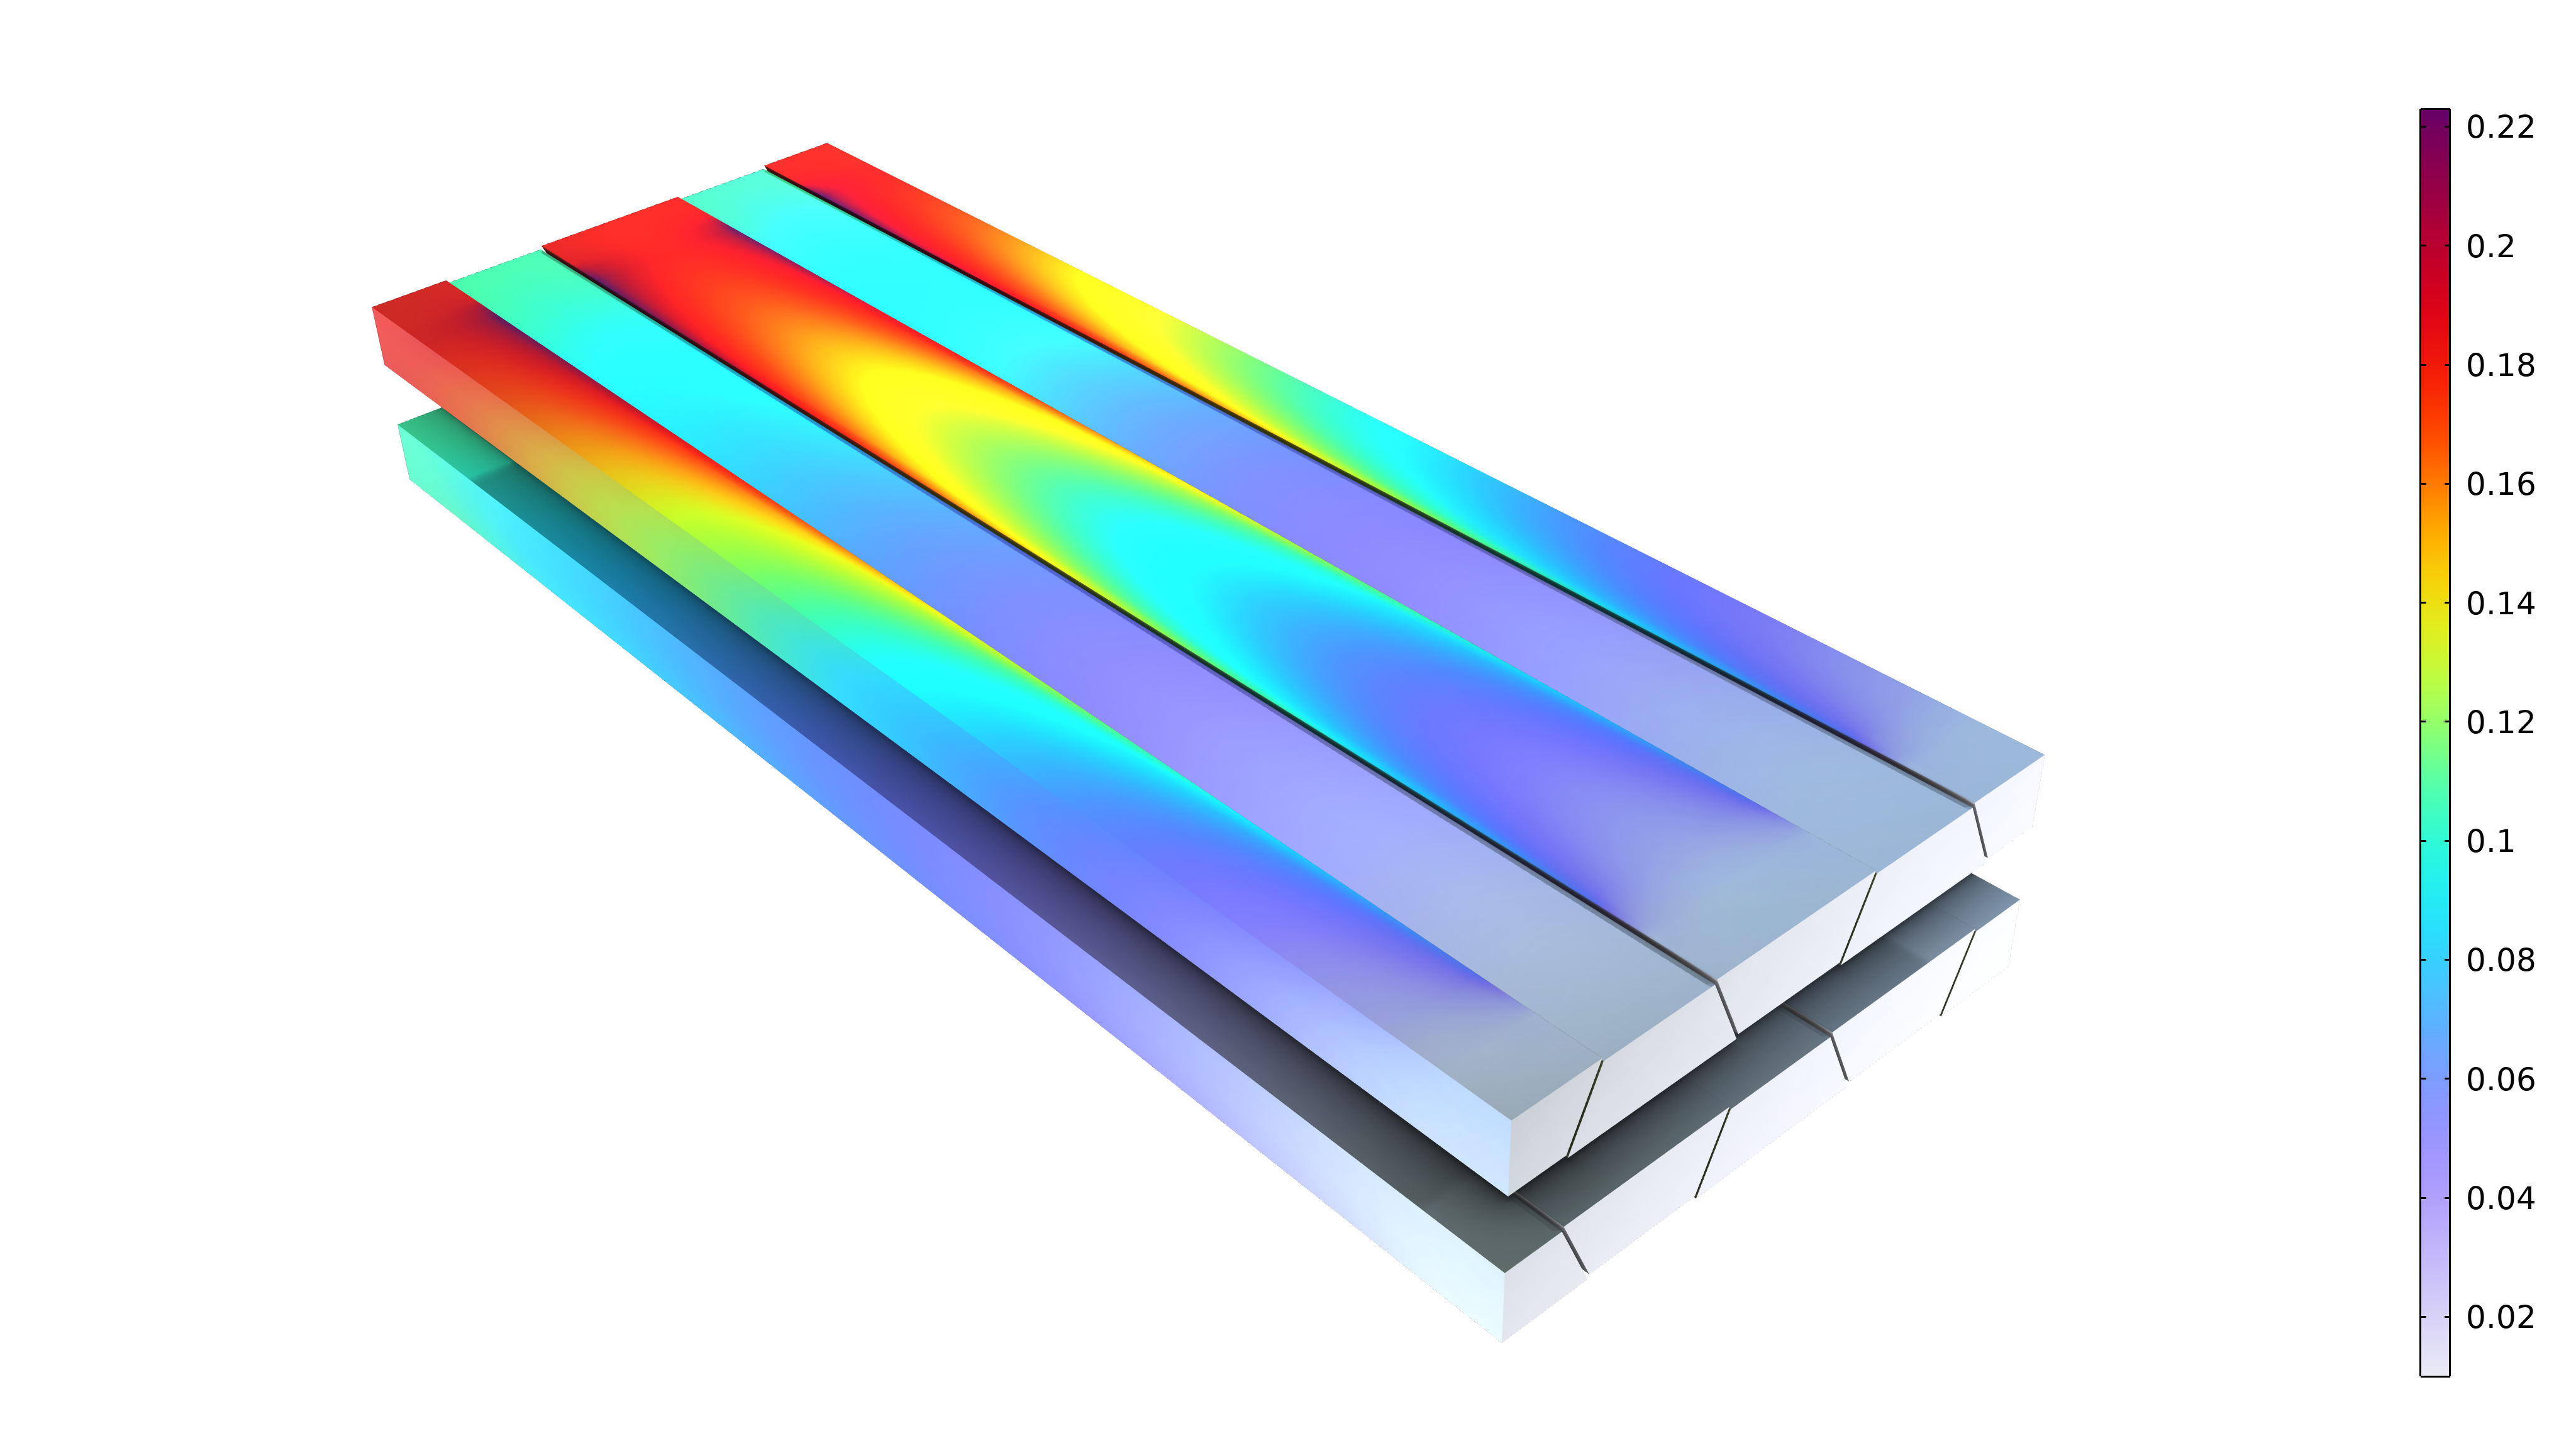
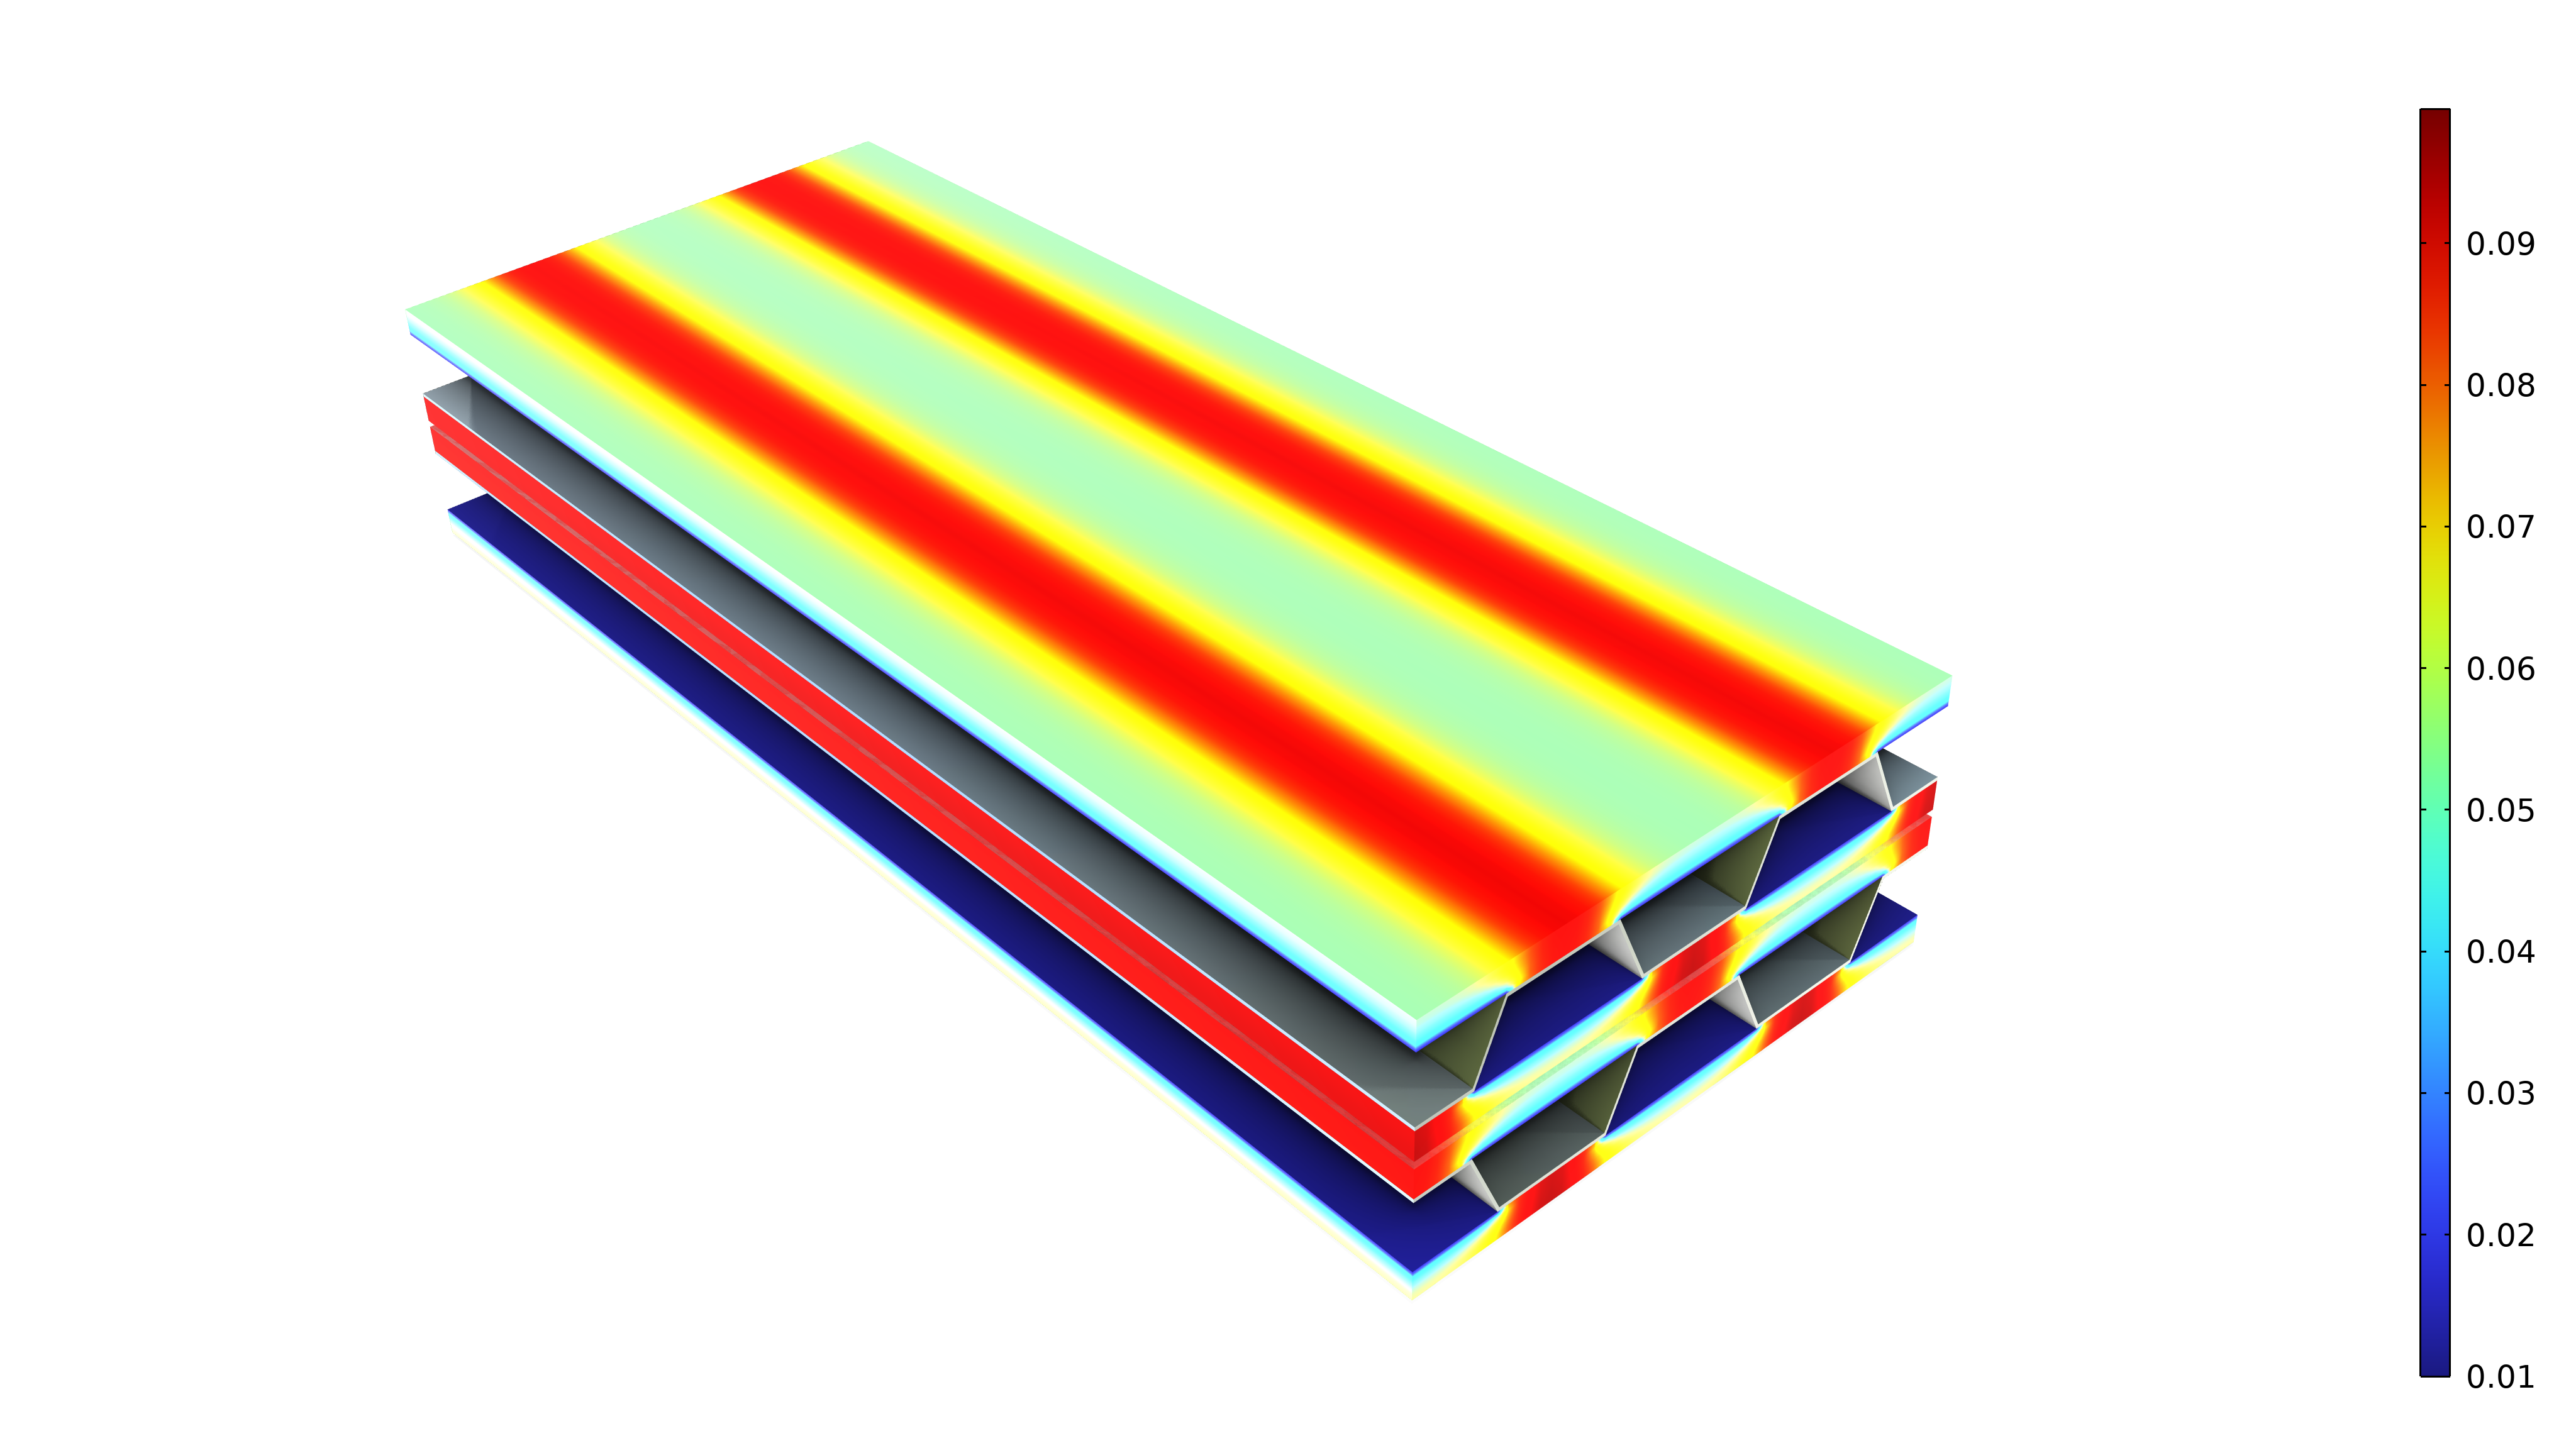
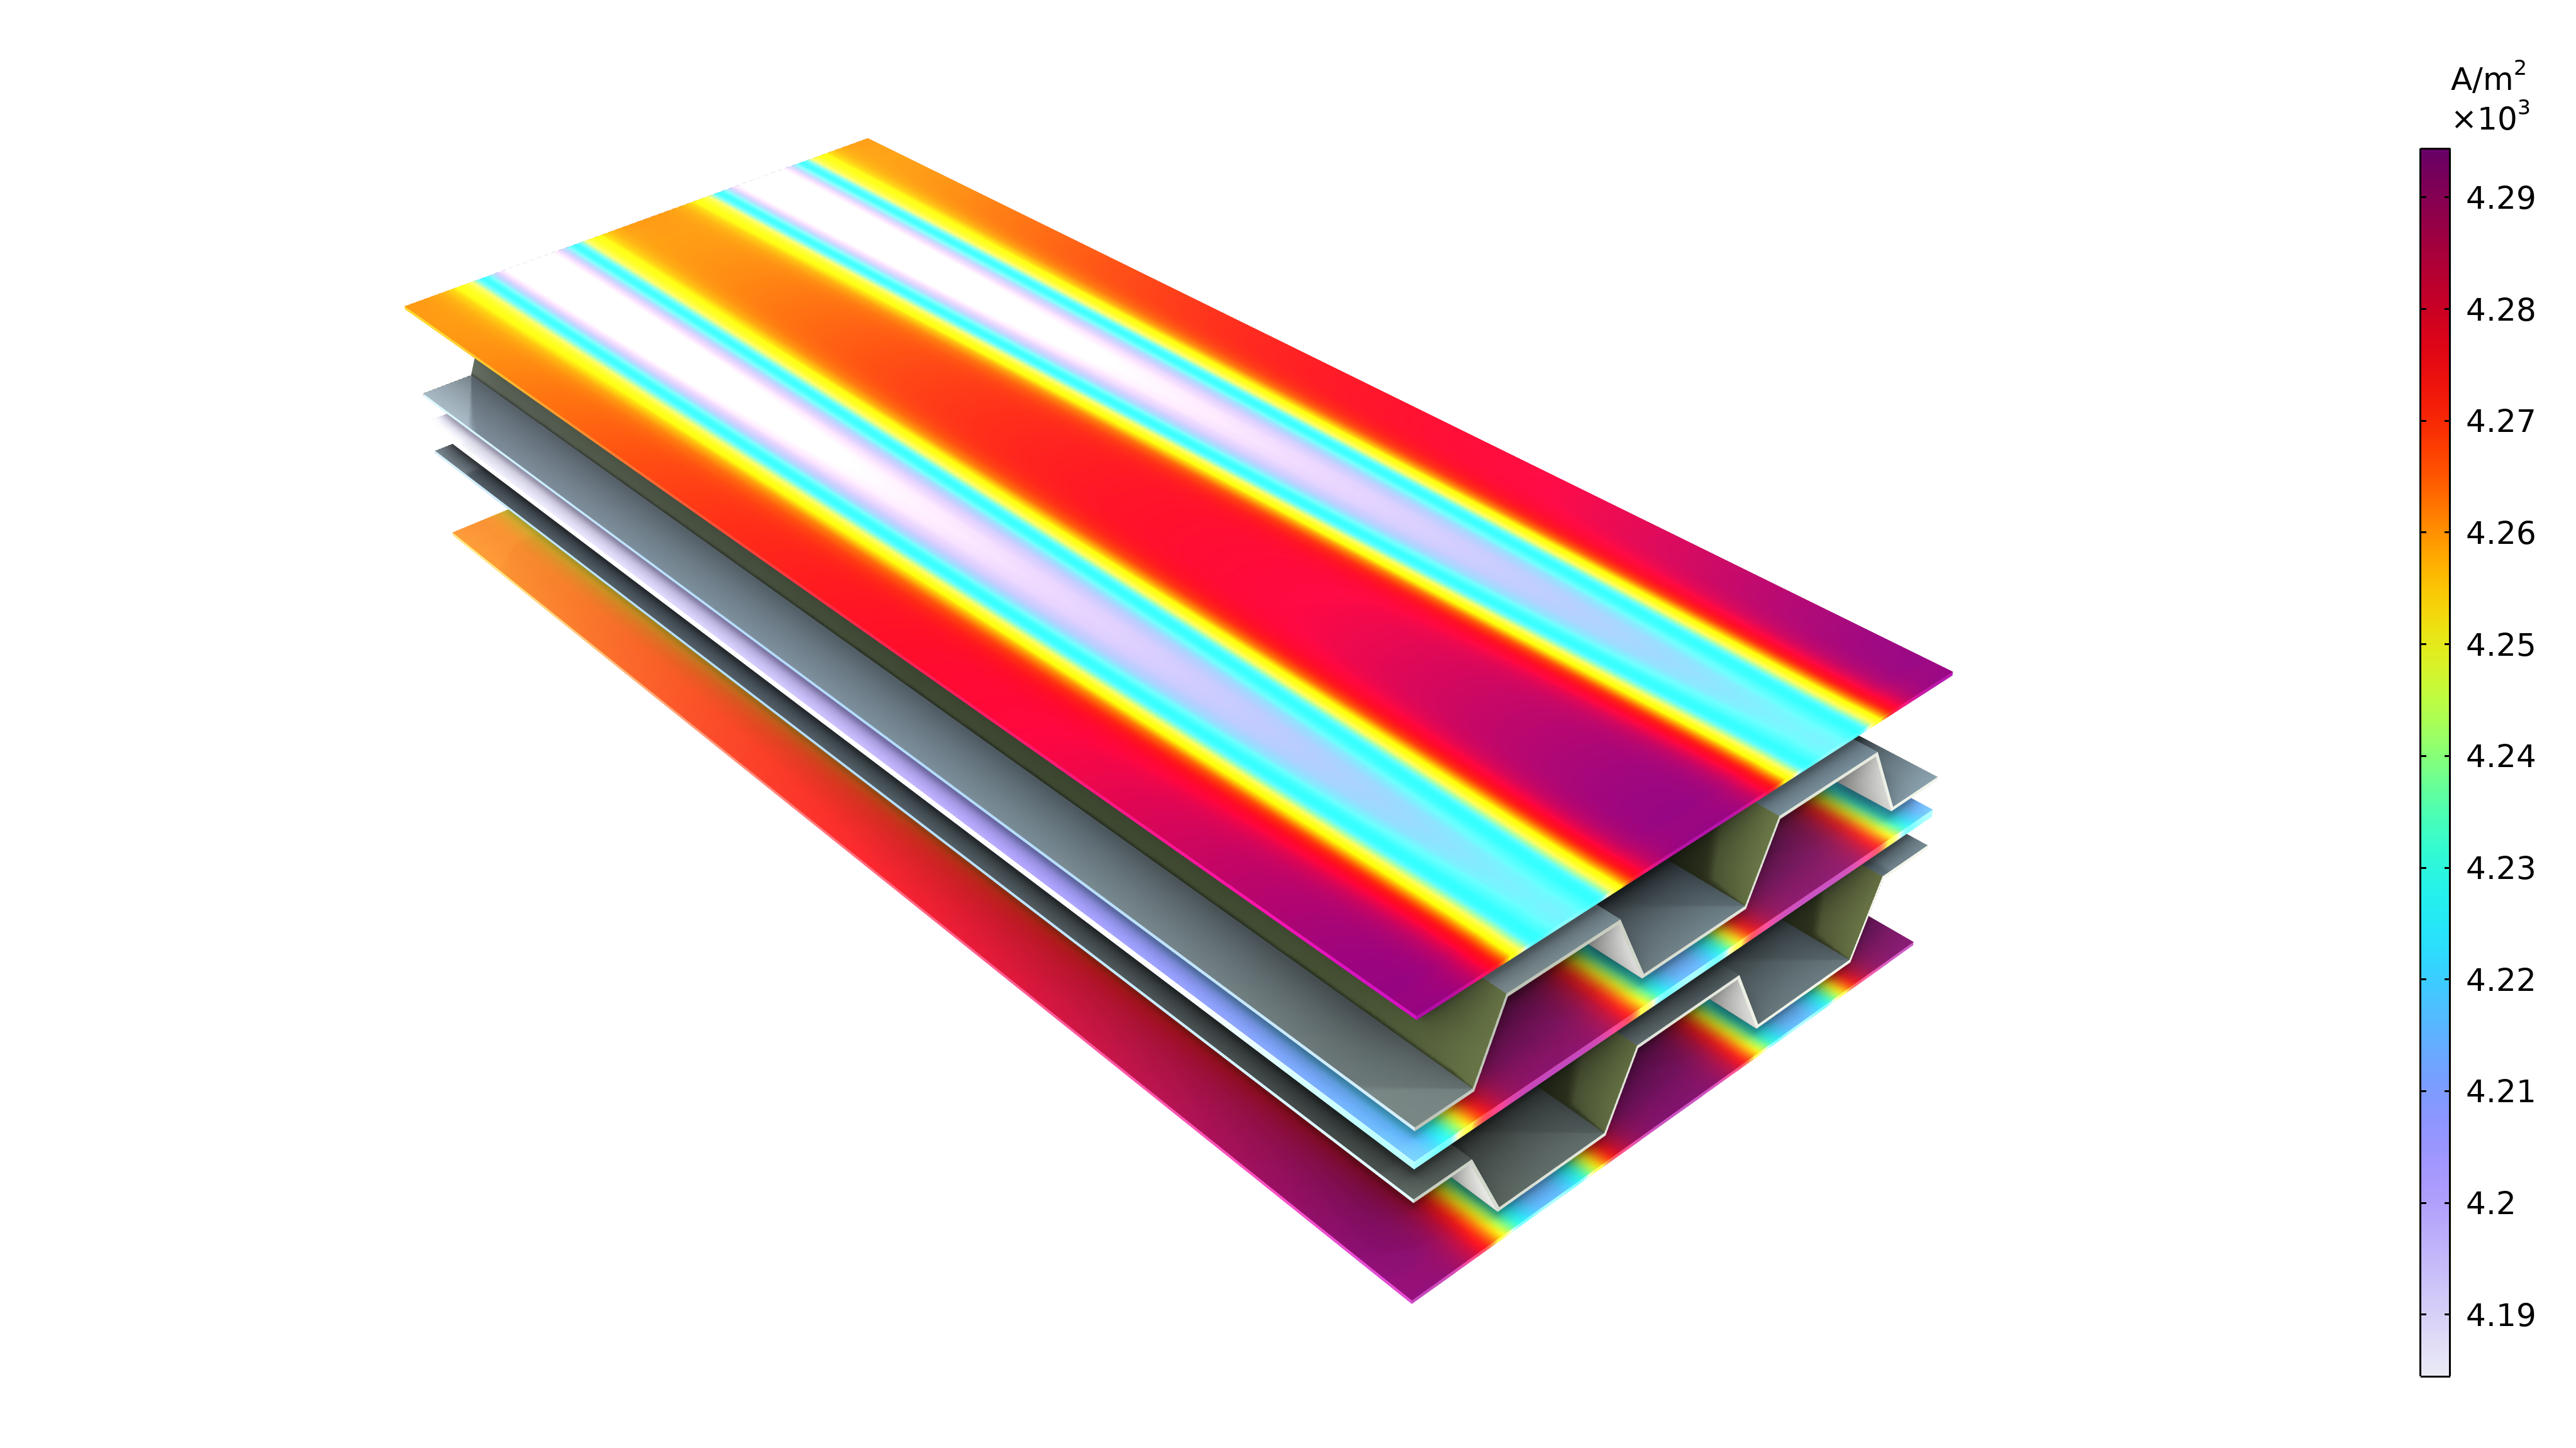
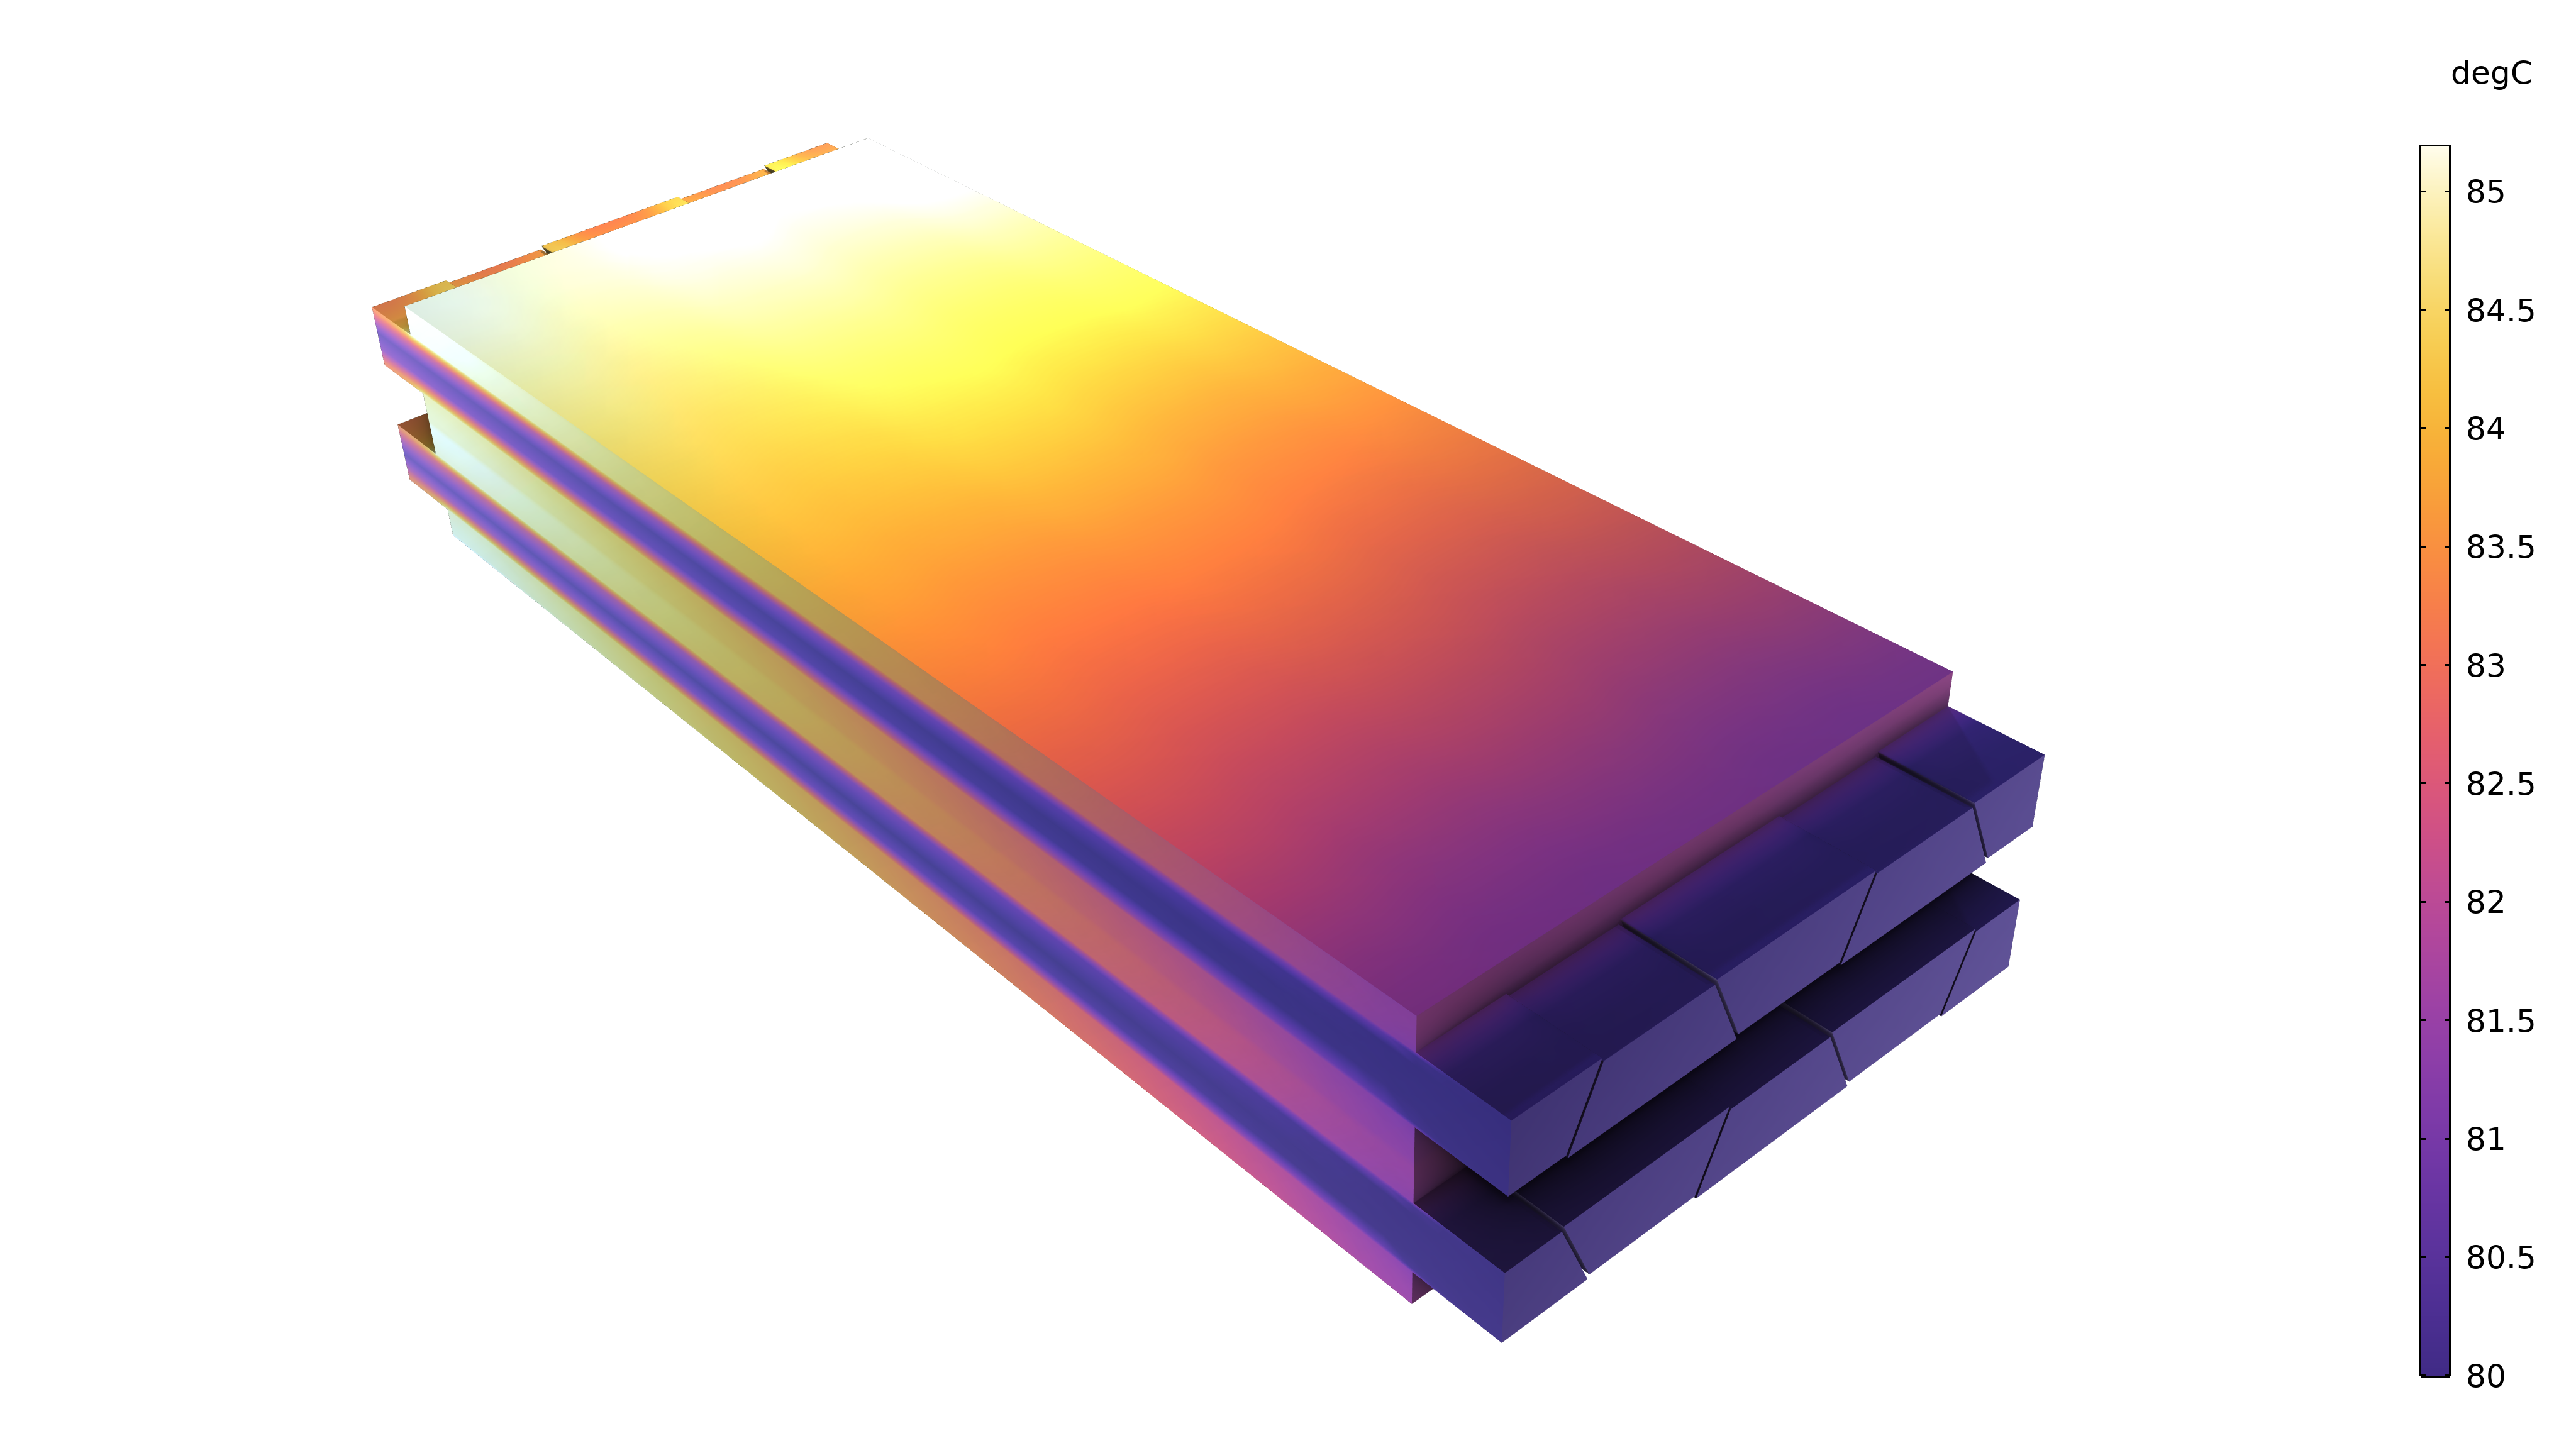
Upper left: the gas volume fraction in the gas and electrolyte channels. Upper right: the gas content in the hydrogen and oxygen GDEs. Lower left: the current density in the diaphragm. Lower right: the temperature distribution.
In the gas volume fraction plot (upper left), showing the gas content in the flow channels, we can see that the gas content is higher in the hydrogen channels, since two hydrogen molecules are produced for every oxygen molecule in the electrolysis (two electrons per hydrogen molecule and four electrons per oxygen molecule). The gas content in the channels increases from the inlet to the outlet, as expected.
In the gas content plots for the GDEs, we can see that gas is trapped in the region between the bipolar plate and the diaphragm, while the gas is efficiently removed in the parts of the GDEs facing the flow channels. This means that we could consider making the corrugated bipolar plates more narrow with more corrugations along the width in order to shorten the path to the flow channels, where gas can leave the cell.
The current density plot (lower left) reflects the gas content in the GDEs. Here, we can see that the current density is higher at the positions that correspond to the flow channels, where the gas content in the GDEs is lower. The trapped gas in the GDEs leads to a lower current density, since it gives a lower pore electrolyte conductivity. This effect is rather small, though. In the model, neither the effect of the gas bubbles blocking the active sites nor the supply of electrolyte are accounted for. If these effects were accounted for, the current density distribution would be more uneven.
The temperature plot at the lower right shows that the temperature increases along the direction of the flow from the inlet to the outlet. In addition, the temperature is higher in the GDEs and the diaphragms, due to the higher Joule heating in the diaphragm and pore electrolyte (poor electrical conductivity) as well as the poor dissipation of heat from the GDEs and the diaphragm.
These results exemplify what simulations engineers and scientists could perform to better understand how different geometry parameters and operating conditions would impact the performance of a cell. As hinted above, the model featured here could be expanded to account for active surface blockages and the electrolyte composition.
Try It Yourself
Looking to model this alkaline water electrolyzer yourself? The MPH-file and step-by-step instructions are available in the Application Gallery.
Further Reading
In this blog post, we focused on a zero-gap alkaline water electrolyzer, but this is just one application for hydrogen production. Explore more modeling scenarios that involve hydrogen production and usage on the COMSOL Blog:

Comments (0)